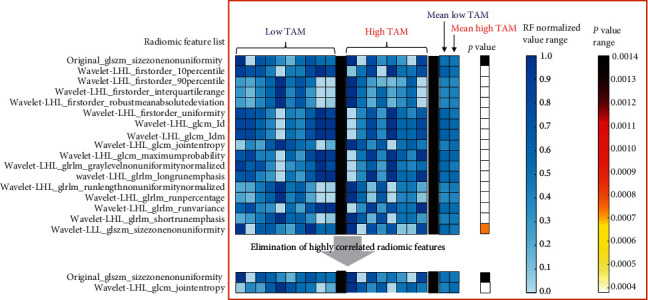
Figure 6.

Radiomic analysis of low and high TAM tumors. List of RFs that differentiated low TAM and high TAM tumor groups. Highly correlated RFs were eliminated, resulting in two RFs, which when fed into a linear classifier yielded an accuracy of 100% for classification and differentiation of tumors based on TAM burden. Each column in low TAM and high TAM groups shows a vector of normalized RF values representing individual tumor sample. Mean values of each RF were calculated for each group. Statistical analysis was performed using the Kruskal–Wallis test to identify RFs that differentiated low TAM and high TAM groups. p < 0.05 was considered statistically significant.
