
Figure 3.
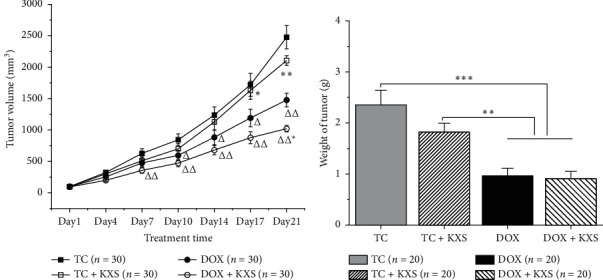
Effects on volume and weight of the tumor. Tumor volume of the 4T1 inoculated breast cancer model (a), mean ± SEM: n = 30, △P < 0.05, △△P < 0.01, and △△△P < 0.001 compared to the TC group; ∗P < 0.05, ∗∗P < 0.01, and ∗∗∗P < 0.001 compared to the DOX group. Tumor weight of the 4T1 inoculated breast cancer model (b), mean ± SEM: n = 20, ∗P < 0.05, ∗∗P < 0.01, and ∗∗∗P < 0.001 compared to DOX and DOX + KXS groups.