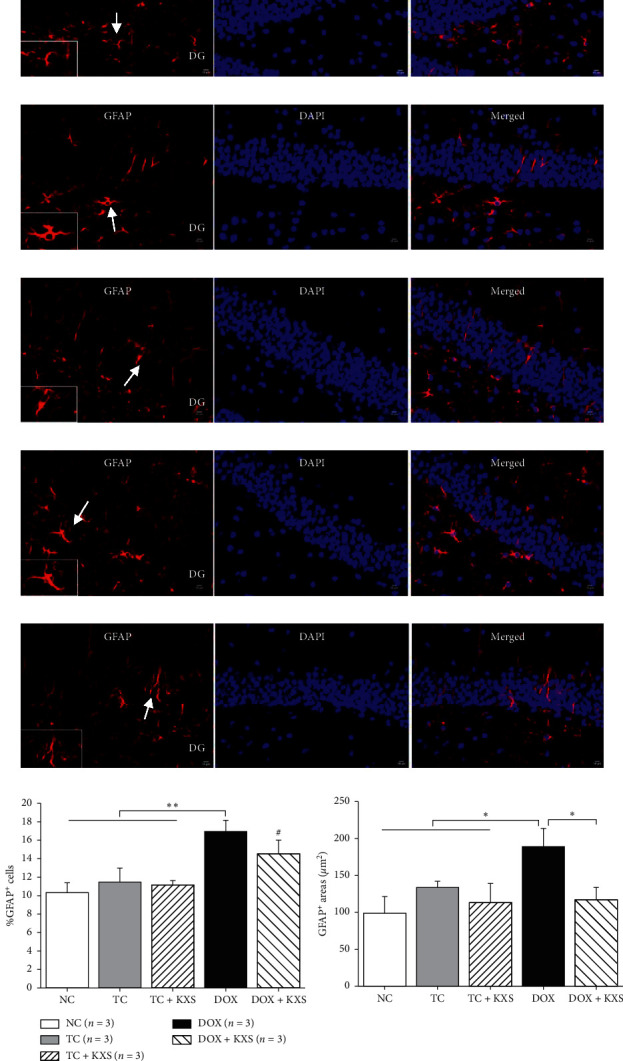
Figure 6.

GFAP immunostaining in the mice hippocampus. Merged overview of the relevant hippocampus region with GFAP in red and nuclear counterstaining with DAPI in blue (magnification 400x). The white arrow depicts the GFAP+ cell shown in the enlarged image. NC group: very mild level of GFAP (a); TC group: moderate level of GFAP (b); TC + KXS group: very mild level of GFAP (c); DOX group: severe level of GFAP (d); DOX + KXS group: moderate level of GFAP (e). IH, scale bar = 50 μm, n = 3/per group. GFAP: Glial fibrillary acidic protein; DAPI: 4′,6-diamidino-2-phenylindole; DG: dentate gyrus. The GFAP+ cells (f) (i) and the area of GFAP+ in the DG (f) (ii). Mean ± SEM, ∗P < 0.05, ∗∗P < 0.01, and ∗∗∗P < 0.001 compared to the DOX group, #P < 0.05, ##P < 0.01, and ###P < 0.001 compared to the NC group.
