FIGURE 7.

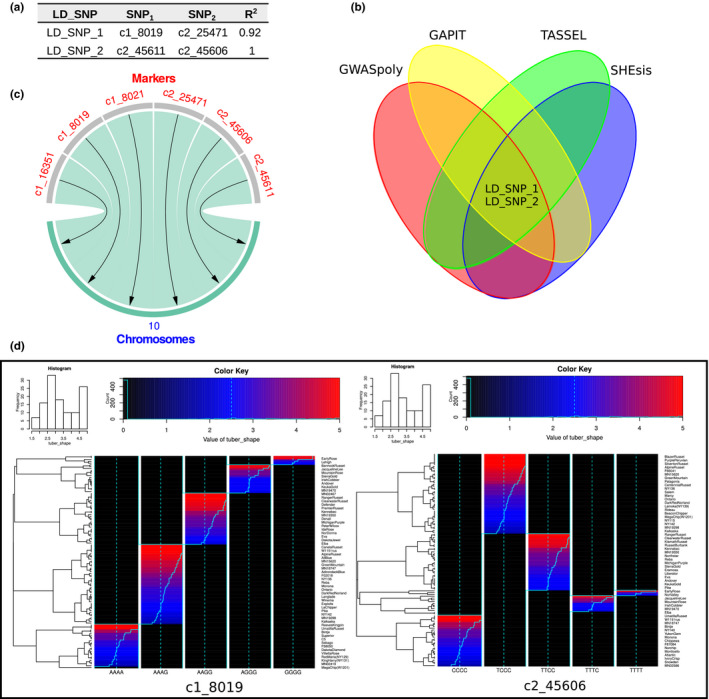
SNPs in LD, SNPs by chromosome, and SNP structure. MultiGWAS brings different views to figure out SNP relationships and structure. (a) Table of pairs of SNPs in LD with columns LD_SNP for an ID given by MultiGWAS to the pair of SNPs; SNP1 and SNP2 for the names of SNPs; and R 2 for the squared correlation value between SNPs. (b) Venn diagram of pairwise SNPs in LD. LD_SNPs in the center show that the four packages simultaneously detected at least one SNP from the pairwise SNPs shown in the table. (c) Chord diagram showing that best‐ranked SNPs are located in chromosome 10. (d) SNP profiles showing the structure of one of the pairwise SNPs in LD
