
FIGURE 8.
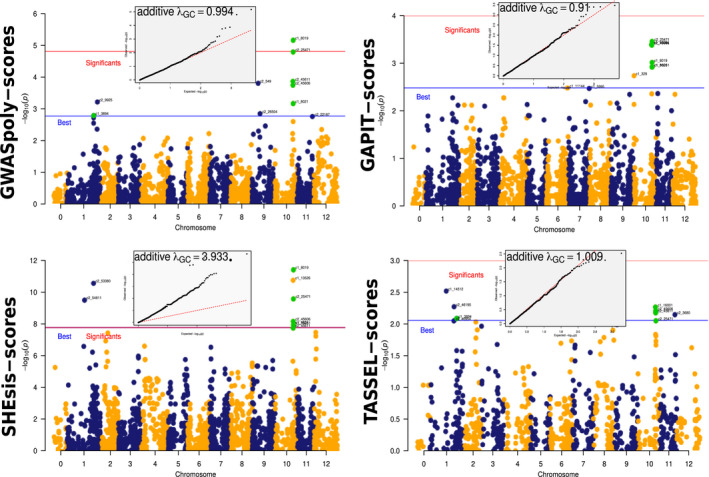
Associations for each GWAS package. MultiGWAS shows the associations identified by the four GWAS packages using Manhattan and Q–Q plots. The tetraploid potato data showed several SNPs shared between the four GWAS packages (green dots). The best‐ranked SNPs are above the blue line, but only GWASpoly and SHEsis identified significant associations (SNPs above the red line) for this dataset. However, the inflation factor given by SHEsis is too high (, at the top of the Q–Q plot), which is observed by the high number of SNPs deviating from the red diagonal of the Q–Q plot