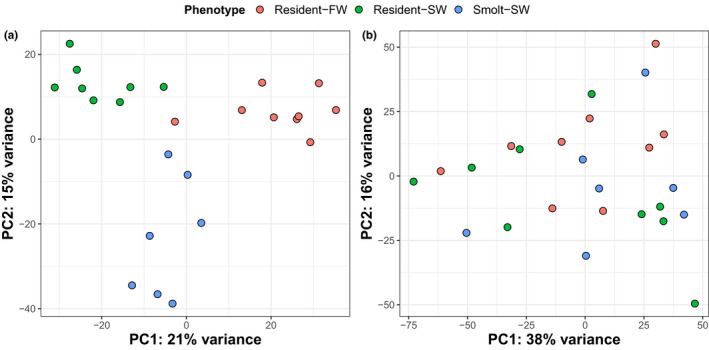
FIGURE 2.

Distinct transcriptional profiles between resident and smolt livers but not brains. Scatterplots displaying the results of a principal component analysis (PCA) for normalized gene expression values for (a) livers and (b) brains collected from three groups differing in phenotype and/or environment. The proportion of variance within gene expression explained by principal component 1 (PC1) and 2 (PC2) is displayed on the x‐axis and y‐axis, respectively. Here, each group is a categorical variable corresponding to the combination of the individual phenotype (life history tactic) and osmotic environment the individual experienced for 24 hr just prior to terminal sampling (salt water or fresh water)
