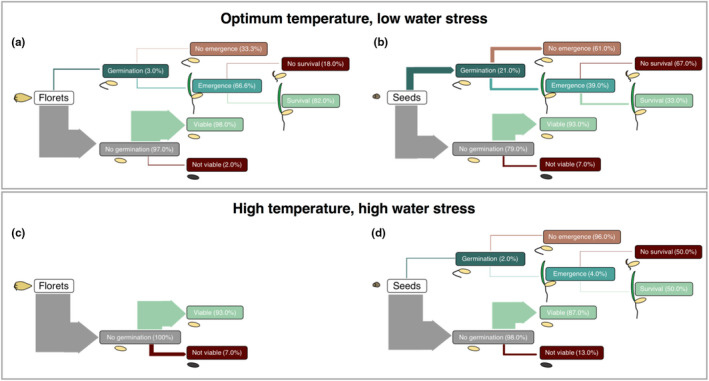
FIGURE 5.

Sankey diagram summarizing the recruitment life‐stage transitions across six keystone Triodia species under optimal (a, b; 25°C and low water stress) and potential future climatic conditions (c, d; 40°C and high water stress). The width of each transition arrow represents the total proportion of the initial seed lot (i.e., 100%) that transitioned to each of the life stages, while the percentages are the number of seeds that transitioned to that life stage as a percentage of the previous life stage
