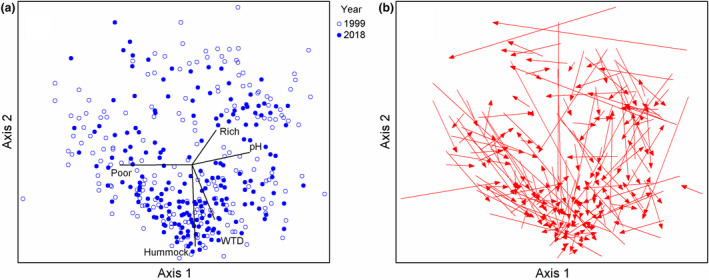
FIGURE 4.

NMDS ordination of combined 1999 and 2018 vegetation plot data. (a) The first axis represents pH gradient, and the second axis water‐table depth (WTD) gradient. Poor, rich, and hummock refers to total covers of rich fen Bryidae, poor fen Sphagnum, and hummock Sphagnum species. (b) Plot locations have moved mainly in the same direction as the second axis representing WTD gradient
