
FIGURE 3.
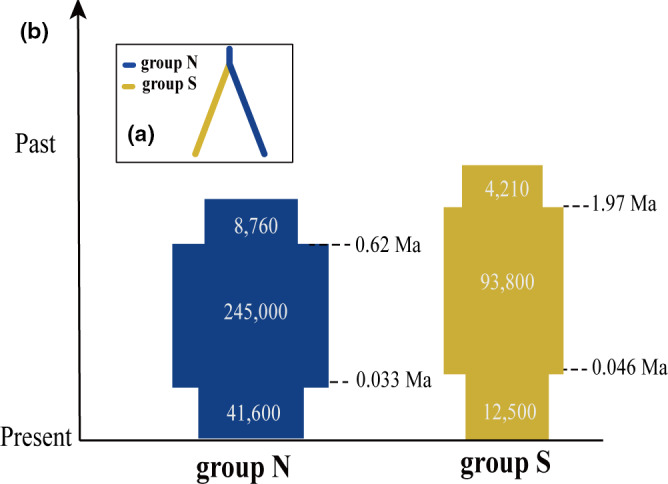
(a) The best ABC divergence model for Myripnois dioica based on diy‐abc analyses; (b) Demographic history of the two lineages under the best‐fitting ABC models. Times of population size changes are indicated by horizontal dashed lines
Official websites use .gov
A
.gov website belongs to an official
government organization in the United States.
Secure .gov websites use HTTPS
A lock (
) or https:// means you've safely
connected to the .gov website. Share sensitive
information only on official, secure websites.
(a) The best ABC divergence model for Myripnois dioica based on diy‐abc analyses; (b) Demographic history of the two lineages under the best‐fitting ABC models. Times of population size changes are indicated by horizontal dashed lines