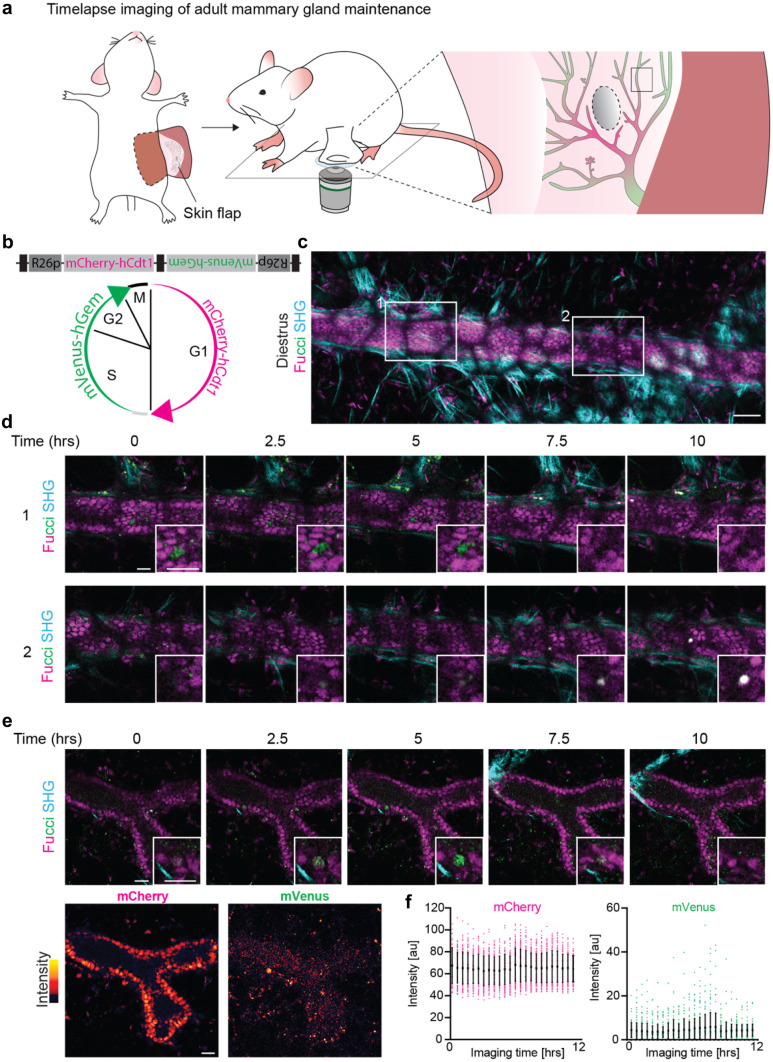
Fig. 4.
Time-lapse imaging of adult mammary gland maintenance. a Cartoon of adult mammary gland imaging through a terminal skin flap. b Cell cycle stage identification by nuclear mVenus (green) or mCherry (pink) expression in the FUCCI2 mouse. The FUCCI2 cassette consists of a bidirectionally conjugated mCherry-hCdt1 and mVenus-hGem under control of R26 promoters (R26p). Black boxes indicate cHS4 (chicken hypersensitive site 4) transcriptional insulators. mCherry-hCdt1 labels G1 and early S phase nuclei in red, and mVenus-hGem labels S, G2 and M phase nuclei in green. White indicates co-existing fluorophores. Note loss of fluorescence (black) during cytokinesis. c Representative confocal image of a FUCCI2 mouse in diestrus. 6 positions were imaged over 10 h. Mammary ducts are identifiable by the dense mCherry labelled nuclei. Note the local low fluorescent intensity by light scattering through the overlying mammary fat pad, that forms a black fishnet-like pattern. Scale bar represents 50 µm. Representative of 4 mice. d Time-lapse high magnifications of optical sections at the indicated areas in c showing two examples of cell cycle transitions from S/G2 to M (upper panel) and from G1 to S phase (lower panel). Insets show a high magnification of the actively cycling cell. SHG is second harmonic generation to visualize collagen I fibers. All scale bars represent 20 µm. e-f Characterization of FUCCI2 fluorescence intensity in the mammary gland over time. e Top, optical sections of a duct with an actively cycling cell (inset). Bottom, intensity map of mCherry and mVenus fluorescence from the same duct. Note the high fluorescence background in the ductal lumen and surrounding fatpad in the mVenus channel. All scale bars represent 20 μm. f Intensity quantifications of the duct in e over the duration of the imaging session (Mean ± SD). Dots represent nuclei. Note constant average intensity in mCherry and mVenus and inherently low mVenus fluorescence intensity

