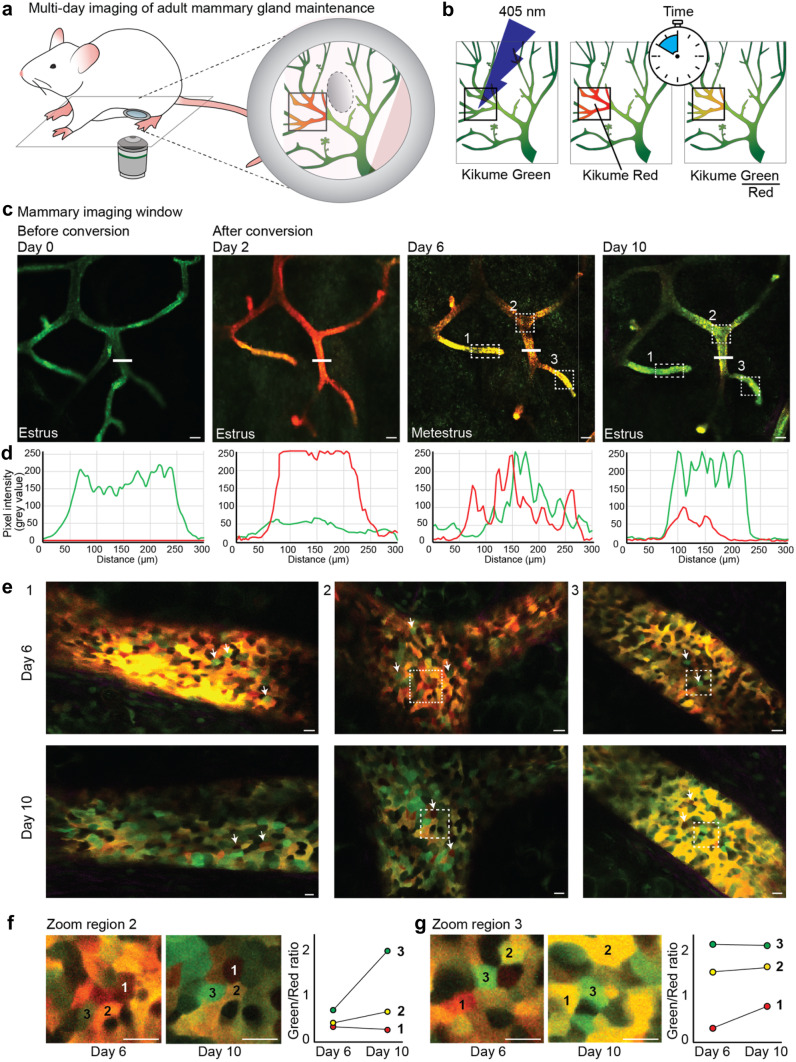
Fig. 5.
Local proliferative heterogeneity during the estrous cycle in the adult mammary gland using the KikGR mouse model. a Cartoon of an adult KikGR mouse, in which a large area of the mammary gland (in green) is photo-converted (red area). b Cartoon illustrating the workflow of KikGR photo-conversion of small areas in the mammary ductal tree by exposure to 405 nm laser light. c Panels showing confocal images of the same ductal area (maximum intensity projection) in a KikGR mouse over a period of 10 days through a MIW, from left to right 0, 2, 6 and 10 days after exposure to 405 nm laser light. Converted areas show similar dilution of the Kikume red signal, indicating a global and equal turnover rate throughout the epithelium. Estrous stages are indicted in the images. Scale bars represent 100 µm. d Line profiles depicting the pixel intensity of green and red signal in the ductal area indicated with the white line in c, prior to photo-conversion (left panel), directly after photo-conversion (second panel) and 6 and 10 days after conversion (third and fourth panel). e Zoom images (single Z-plane) of different ductal areas indicated with the white boxes in panel c 6 and 10 days after photo-conversion, showing wide-spread proliferative heterogeneity at the cellular level. White arrows indicate highly proliferative (green) cells (upper panels) and low proliferative (red) cells (lower panels). Scale bars represent 10 µm. f and g Zoom image of region 2 f and region 3 g in which the same cells can be identified 6 and 10 days after photoconversion. Green/red ratio was determined for three neighboring cells, indicated by 1–3, 6 and 10 days after photoconversion (right graphs), illustrating different signal dilution rates of cells within the same tissue neighborhood. Scale bars represent 10 µm. Images and analyses are representative of 4 independent experiments in 4 different mice

