Fig. 4.
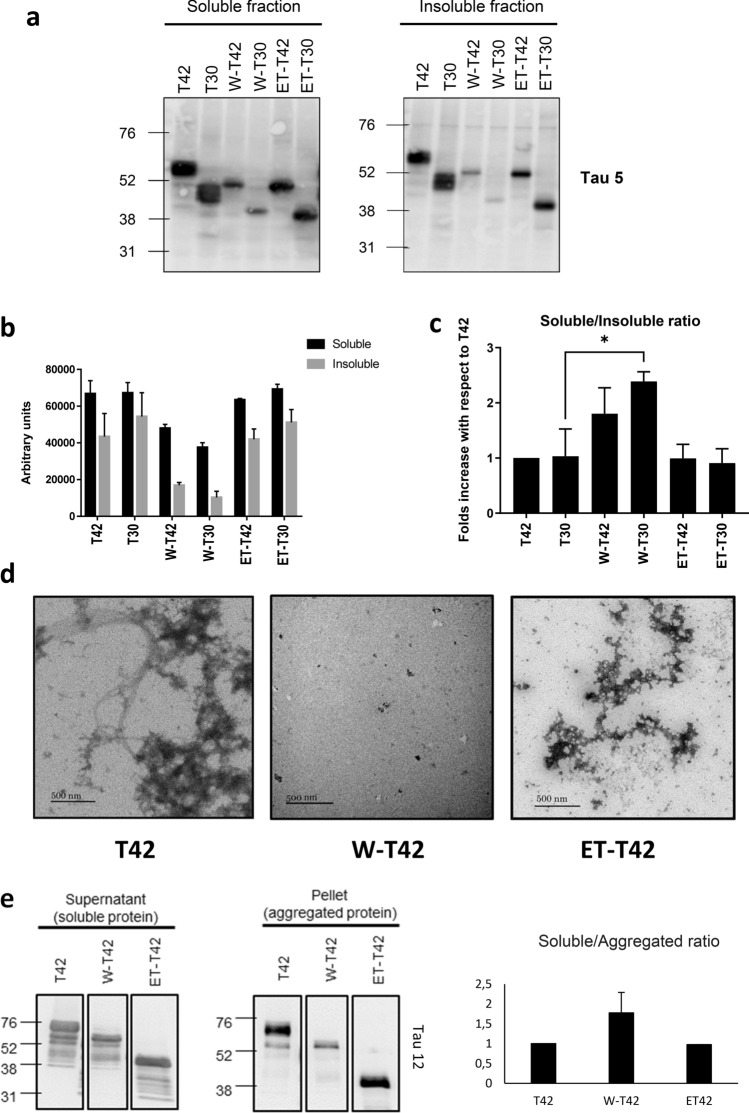
W-Tau aggregation capacity. a Representative Western blot of the presence of Tau in 1% sarkosyl-soluble and insoluble cell fractions of HEK293T cell overexpressing different Tau isoforms (T42, T30, W-T42, W-T30, ET-42 and ET-T30) detected with Tau 5 antibody. b, c Quantification of the signal obtained from Tau 5 showing sarkosyl-soluble vs insoluble fractions (b) or soluble/insoluble ratio (c). Graphs show means and SEM (N = 3). One-way ANOVA for multiple comparisons followed by a Kruskal–Wallis test was performed to compare each isoform with the correspondent full-length isoform, *p ≤ 0.05. d Representative electron microscopy images of Tau aggregates obtained upon in vitro incubation from partially purified T42, W-T42, and ET-42 extracts from bacteria in the presence of heparin to prompt aggregates formation. Scale bars show 500 nm wide. e Western blot showing soluble (supernatant) and aggregated (pellet) protein from the incubation in d, upon centrifugation to separate both fractions. Quantification shows the ratio between soluble and aggregated protein

