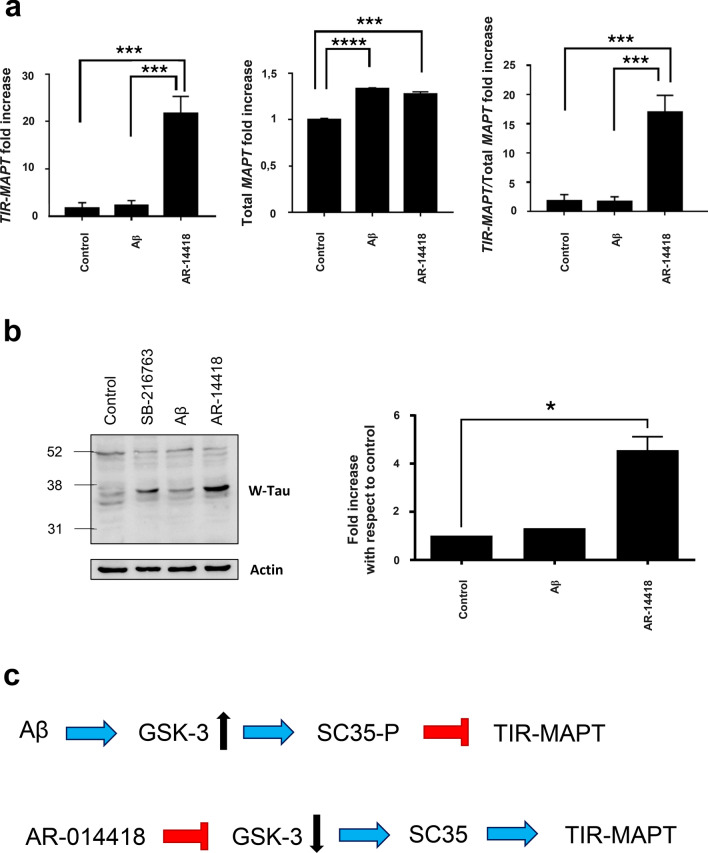
Fig. 5.
Modulation of TIR-MAPT and W-Tau by GSK3. a. Detection of mature cytoplasmic RNA levels of TIR-MAPT, total MAPT and the ratio TIR-MAPT/total MAPT in SK-N-MC human neuroblastoma cell line in the absence or presence of 5 µg/ml amyloid-β1–42 and the GSK3 inhibitor AR-014418 (10 µM) for 24 h. Graphs show mean and SEM. One-way ANOVA and Dunnett’s multiple comparisons test were performed and statistical significance between untreated and cells treated with either Aβ1–42 and AR-014418 was given. ***p ≤ 0.001; ****p ≤ 0.0001. b Western blot analysis of the protein levels of W-Tau (W-Tau antibody) in SK-N-MC cells treated with SB216763 (25 µM), Aβ1–42 (1.1 µM) or AR-14418 (10 µM). Right panel shows the quantification of the signal of complete lanes obtained with W-Tau antibody. Graphs show mean and SEM. One-way ANOVA for multiple comparisons followed by a Kruskal–Wallis test was performed to compare treated and untreated cells. *p ≤ 0.05. c Schematic representation of the modulation of TIR-MAPT by splicing factor SC35, regulated by GSK3-mediated phosphorylation. Blue arrows represent activation; red, truncated arrows represent inhibition

