Fig. 6.
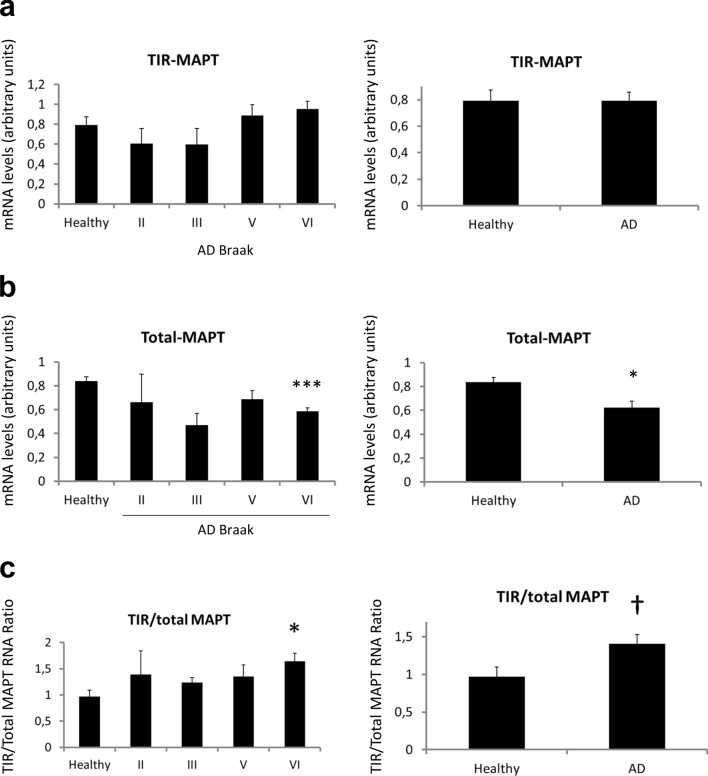
TIR-MAPT RNA expression in the brains of AD patients. a Measurement of TIR-MAPT, b total MAPT and c TIR-MAPT/total MAPT ratio of RNA levels by RT-qPCR of non-demented (n = 8) and AD hippocampal samples (n = 16) classified according to their Braak stage (Braak II n = 3, Braak III n = 2, Braak V n = 7 and Braak VI n = 4), and healthy vs. AD patients. Graphs show means and SE. One-way ANOVA and Dunnett’s multiple comparisons test were performed and statistical significance of each group with respect to non-demented control individuals was given. For comparisons between non-demented individuals and AD patients as groups, p values were calculated using a T test (*p ≤ 0.05; ***p ≤ 0.001, †p = 0,078)

