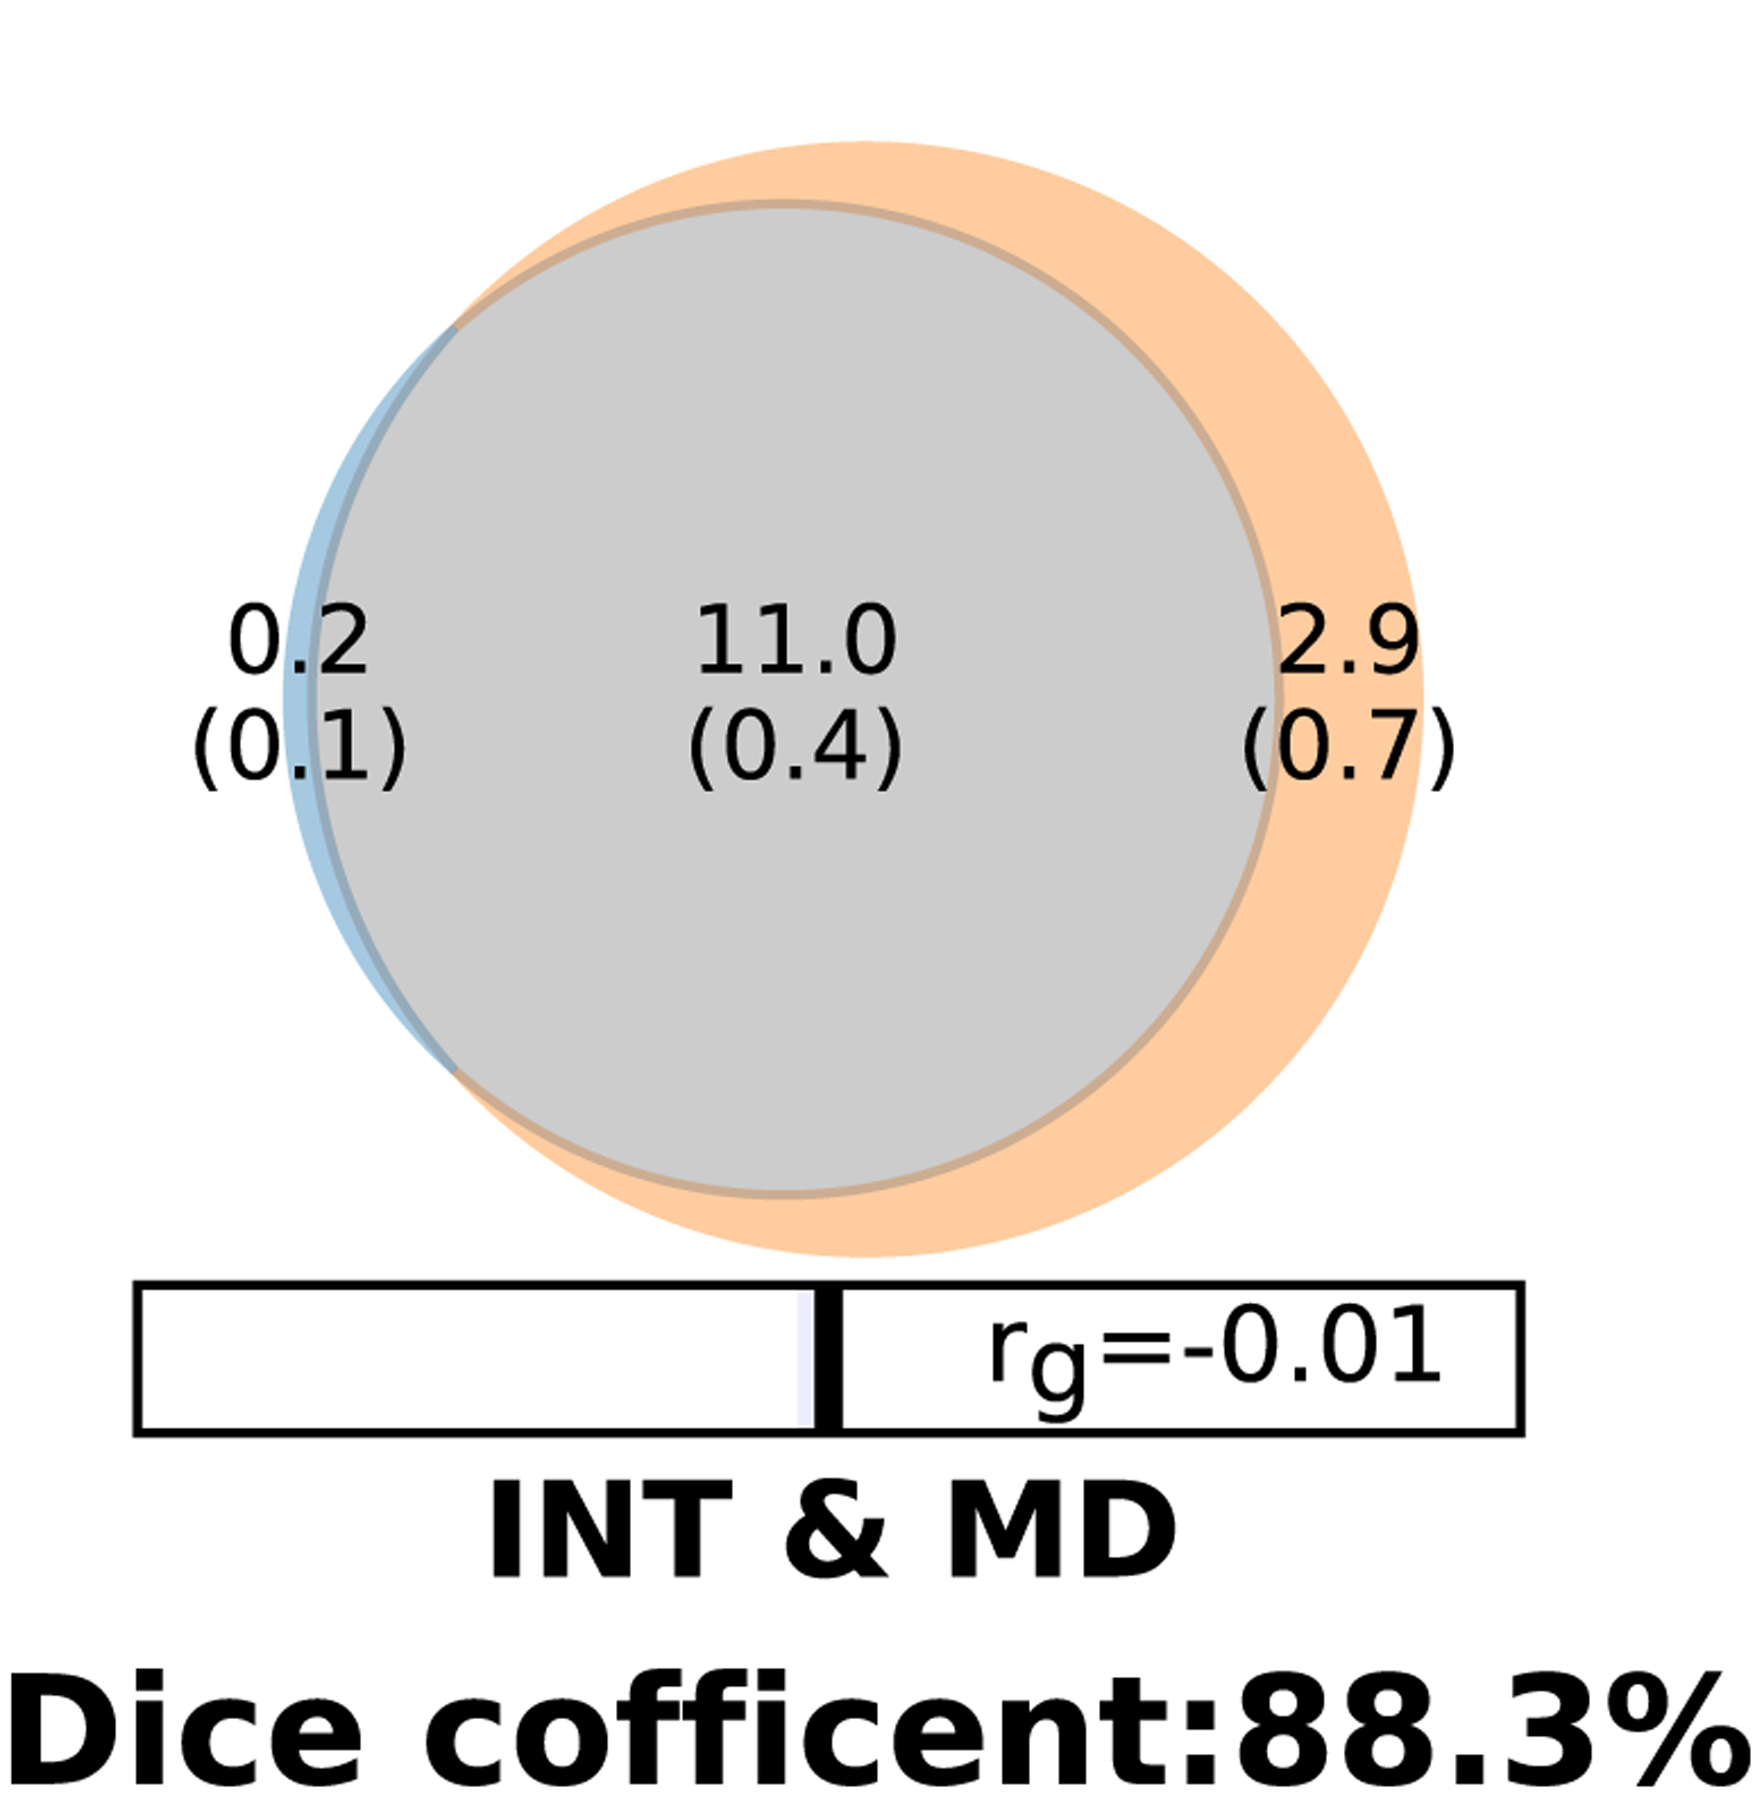
Figure 1.

Venn diagram shows the estimated number of causal variants shared (grey) between intelligence (INT) and major depression (MD) and unique (colors) to either of them. The number of causal variants in thousands is shown, with the standard error in thousands provided in parentheses. The Dice coefficient, which is the percentage of shared causal variants between two phenotypes, is 88.3. The genetic correlation (rg) is estimated between the two phenotypes.
