
Figure 3. Manhattan Plot.
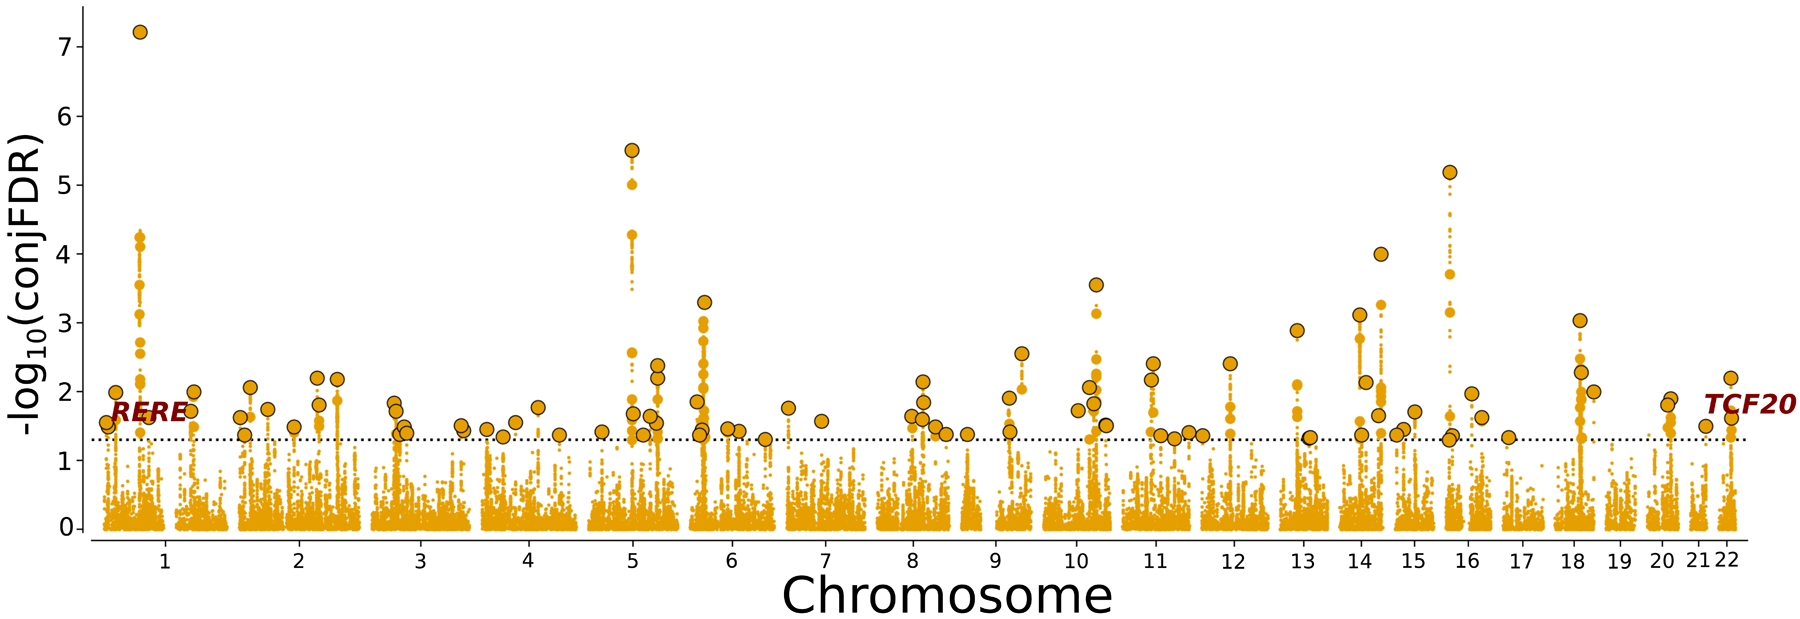
Common genetic variants jointly associated with major depression and intelligence at conjunctional false discovery rate (conjFDR)<0.05. Manhattan plot showing the −log10 transformed conjFDR values for each SNP on the y-axis and chromosomal positions along the x-axis. The dotted horizontal line represents the threshold for significant shared associations (conjFDR<0.05). Independent lead SNPs are encircled in black. The significant shared signal in the major histocompatibility complex region (chr6:25119106–33854733) is represented by one independent lead SNP. Further details are provided in Supplementary Table 3.