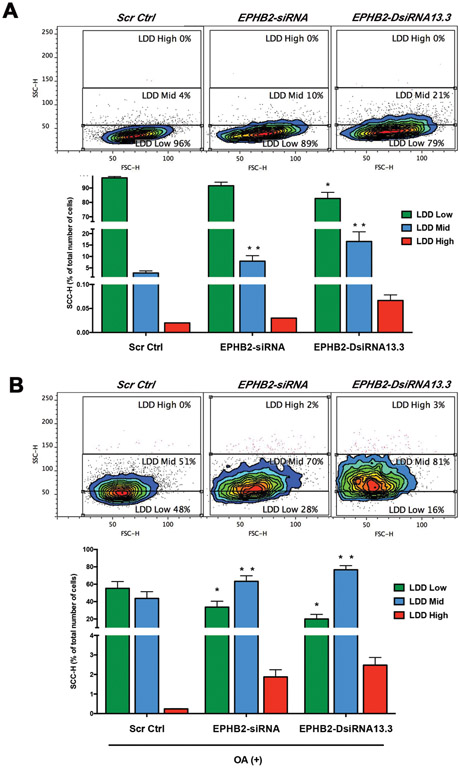
Figure 2. Loss of EPHB2 increases lipid storage in prostate cells.
A. EPHB2 was knockdown in BPH1 cells and culture in the presence/absence of OA before harvested for flow cytometry analysis. Dot plot of side scatter (SSC; x-axis) versus forward scatter (FSC; y-axis) of BPH1 cells show the granularity distribution divided in three gates that included: a) the LDD Low region representing the majority of BPH1 cells under basal conditions (blue edges of the contour plot), b) LDD mid that included control BPH1 with the highest granularity values for Scr Ctrl cells and c) LDD high regions (Left). Analysis of lipid content based on the quantitation of the percentage of cells/gate (Right). B. LNCaP EPHB2 knockdown and Scr Ctrl cells were exposed lipid overload (OA) before LDD flow cytometry analysis of granularity distribution (Left). Bar graph shows the quantitation of the percentage of LNCaP cells in each gate is (Right). * = p<0.05

