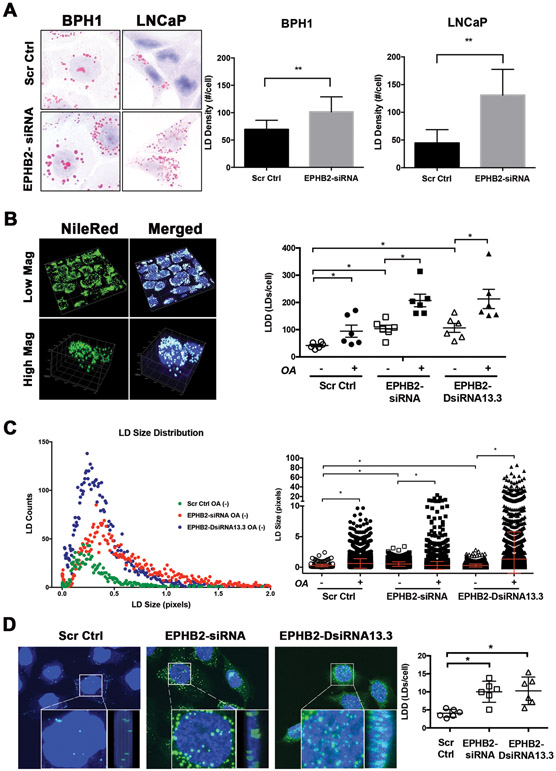
Figure 3. EPHB2 loss induces lipid droplet accumulation in prostate cancer cells.
A. BPH1 and LNCaP engineered cells expressing EPHB2 siRNA and their corresponding Scr Ctrl were stained with Oil-Red-O to identify LDs (Left panel). LD density per cell in BPH1 and LNCaP cells was quantified and compared between knockdown and control groups. B. To determine the 3D content of LD, NileRed (green) and DAPI (blue) dual staining was performed, imaged with confocal microscopy and analyzed using the LD quantification software ALDQ (Left panel). ALDQ quantification of NileRed LDs in control and knockdown cells in the presence/absence of OA (Right panel). C. Scatter dot plot of LD size distribution obtained from ALDQ analyzed images in EPHB2 siRNA (red), DsiRNA13.3 (blue) knock down cells compared to controls cells (green) (Left panel). Analysis of LD size of silenced EPHB2 and Scr Ctrl cells exposed to OA was compared to basal (OA-) levels (Right panel). D. Confocal 3D images of nuclear LD revealed the presence LDs aligned near the cytoplasm/nuclear interphase (inner panels; front and side view) and sparse within the nucleus (Left panel). ALDQ quantification of nuclear LD in EPHB2 knockdown cells was compared to Scr Ctrl cells (Right panel). * = p<0.05

