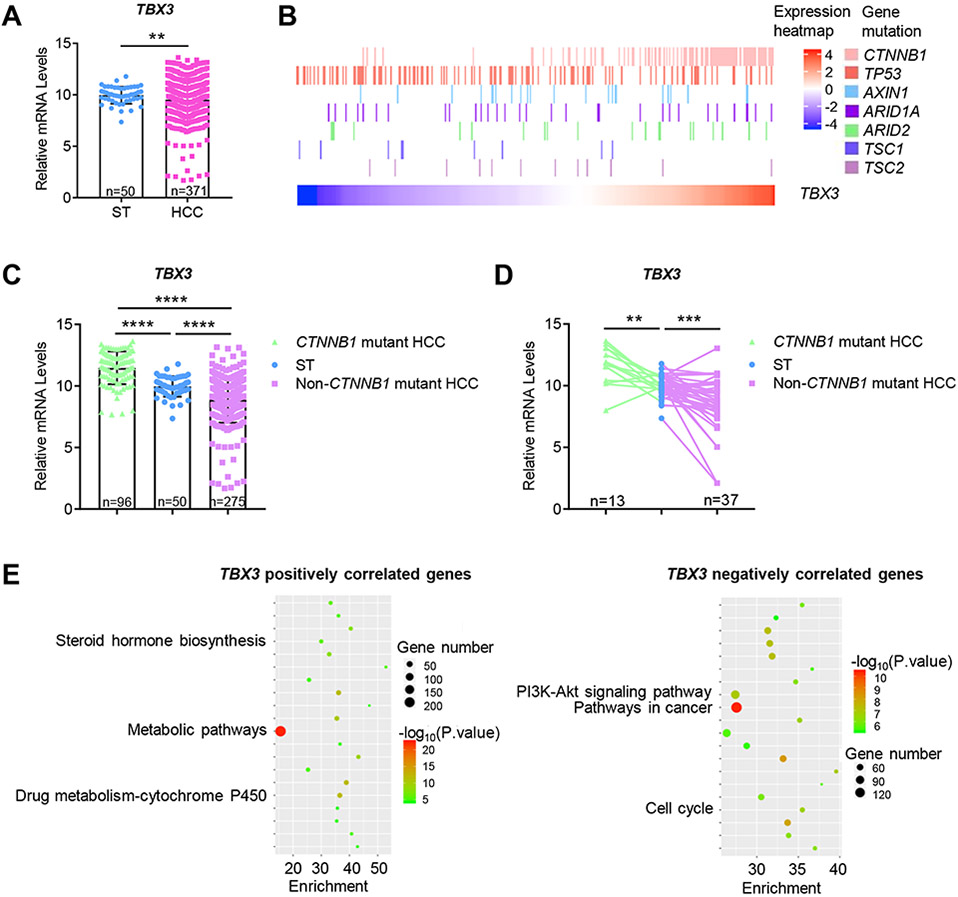
Fig. 1. Expression pattern of TBX3 mRNA in human HCC samples based on the TCGA-LIHC dataset.
(A) The overall expression of TBX3 mRNA. (B) Heatmap of TBX3 mRNA levels with common gene mutations involved in HCCs. (C) TBX3 mRNA expression is upregulated in GOF CTNNB1 mutation HCCs and downregulated in non-CTNNB1 mutant HCCs when compared to ST. (D) TBX3 mRNA expression in paired samples. (E) KEGG pathway analysis of TBX3 co-expressed genes. HCC, hepatocellular carcinoma; ST, surrounding liver tissues; GOF, gain of function. **P < 0.01; ***P < 0.001; ****P < 0.0001. (A) Mean ± SD; Welch's t-test. (C) Mean ± SD; One-way ANOVA test. (D) Paired t-test.

