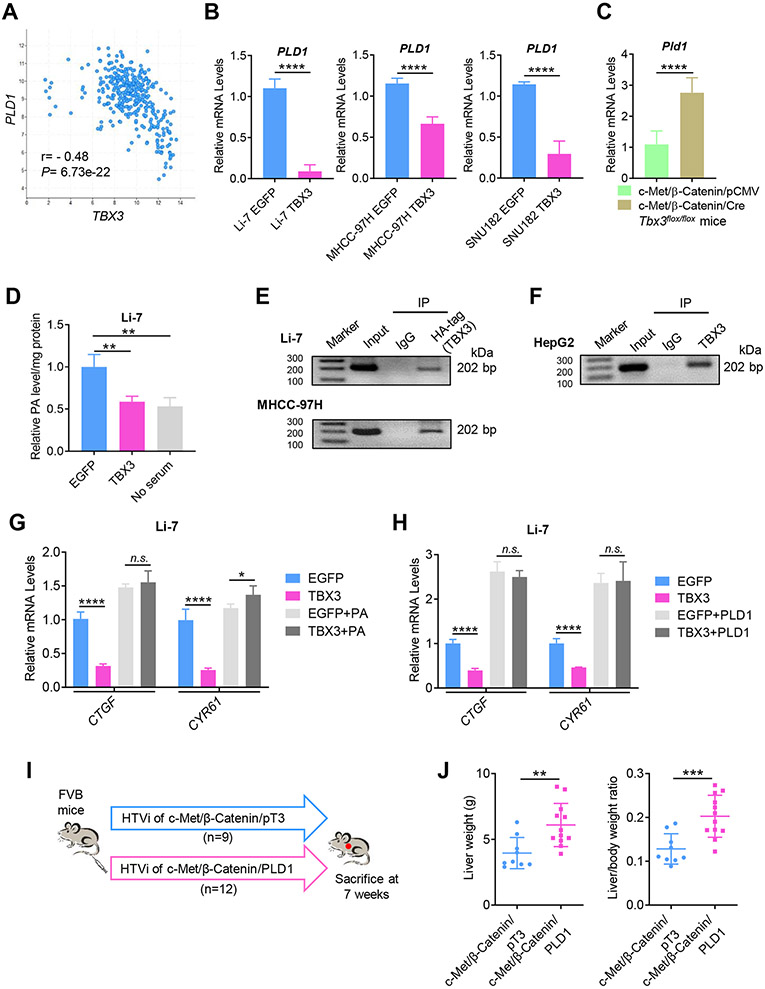
Fig. 7. TBX3 directly represses PLD1 expression at transcriptional level leading to inhibition of YAP/TAZ activity.
(A) TBX3 mRNA expression is negatively correlated with PLD1 mRNA expression in the TCGA-LIHC dataset. (B) Overexpression of TBX3 significantly reduces PLD1 mRNA expression in human HCC cell lines. (C) Ablation of Tbx3 significantly increases Pld1 mRNA expression in c-Met/β-Catenin mouse HCCs. (D) Overexpression of TBX3 leads to reduced cellular PA levels in Li-7 HCC cells. No serum was used as a control. (E) ChIP-PCR assay shows that exogenous TBX3 protein directly binds to the PLD1 promoter in Li-7 and MHCC-97H cells. (F) ChIP-PCR assay shows that endogenous TBX3 protein directly binds to the PLD1 promoter in HepG2 cells. (G) qRT-PCR shows that exogenous PA rescues TBX3 induced downregulation of YAP/TAZ targets (CTGF and CYR61). (H) qRT-PCR shows that overexpression of PLD1 prevents TBX3 induced downregulation of CTGF and CYR61. (I) Study design. (J) The liver weight and liver to body weight ratio of c-Met/β-Catenin/PLD1 and c-Met/β-Catenin/pT3 mice. r, Spearman’s correlation coefficient; IP, immunoprecipitation; ChIP-PCR: Chromatin immunoprecipitation-PCR; qRT-PCR, quantitative reverse transcription PCR; HTVi, hydrodynamic tail vein injection. n.s., not significant; *P < 0.05; **P < 0.01; ***P < 0.001; ****P < 0.0001. (B, C, J) Mean ± SD; Unpaired t-test or Welch's t-test. (D, G, H) Mean ± SD; One-way ANOVA test.

