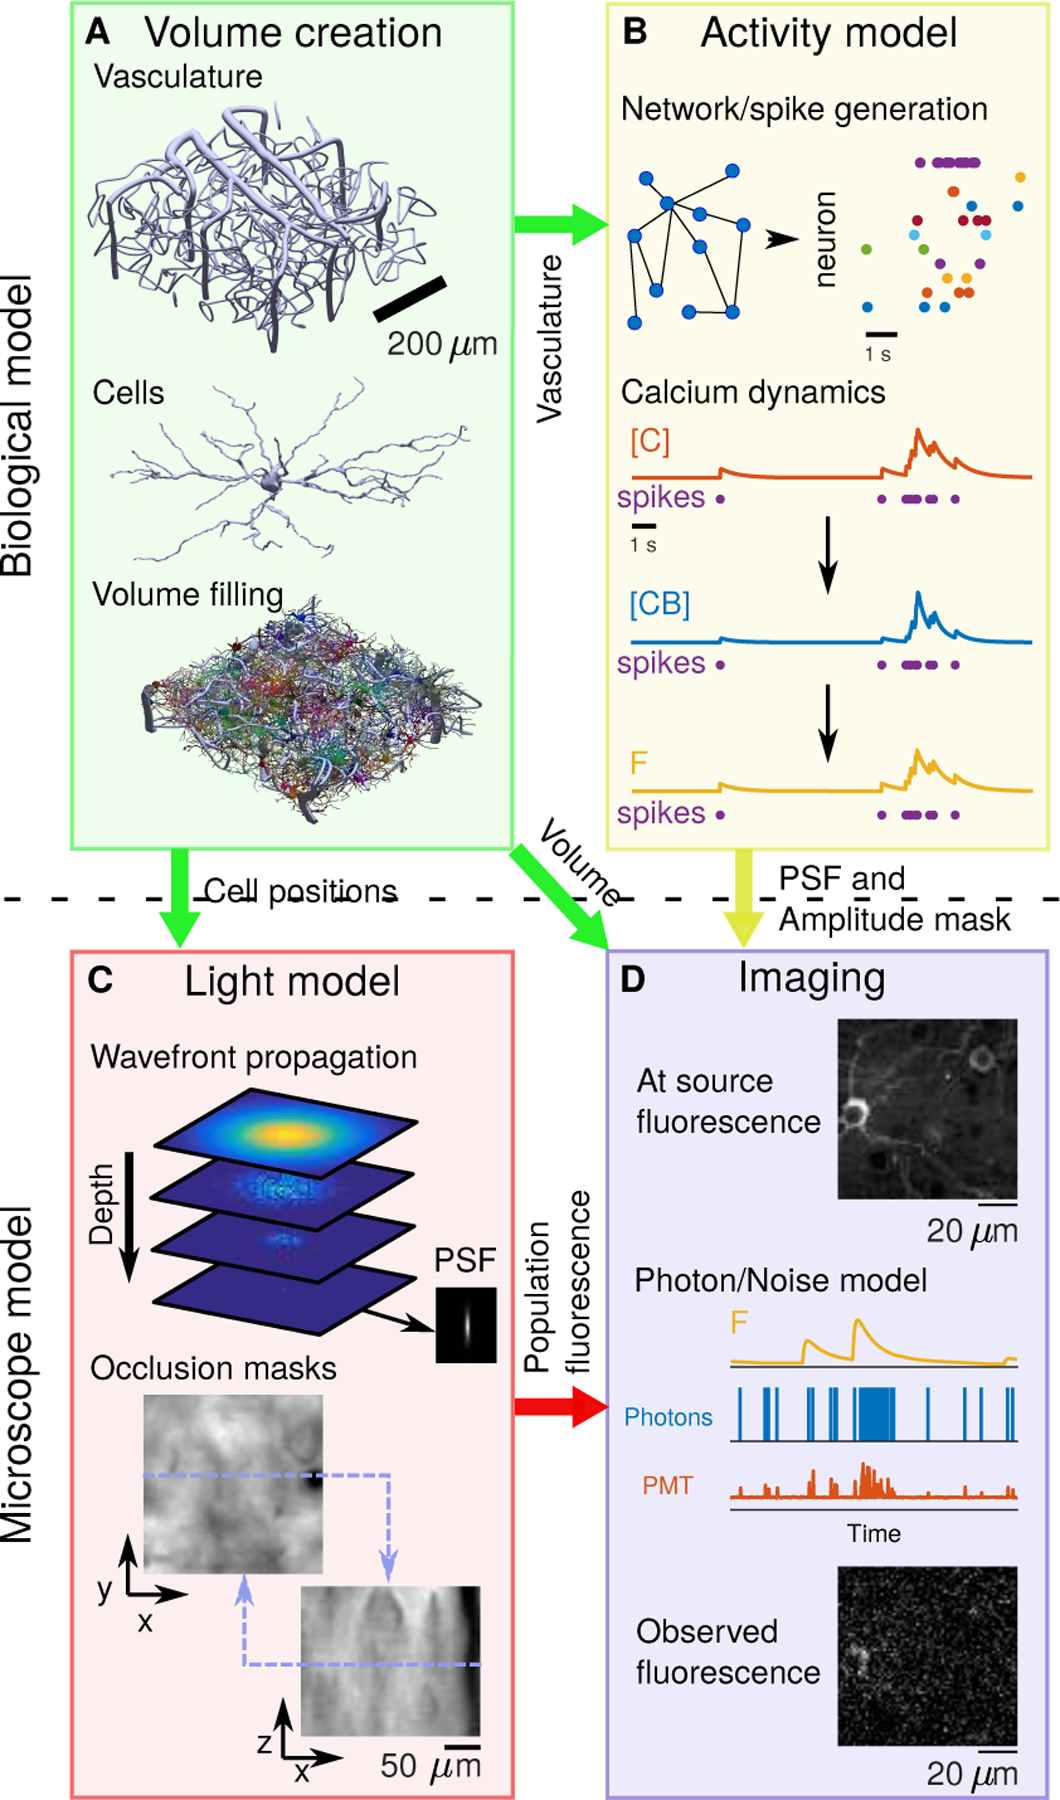
Figure 1:

Block diagram of NAOMi simulator. A: Neural volume generation process. Vasculature is generated throughout the volume, followed by cell bodies and finally dendrites and axons are grown. B: Network activity generation. The spiking activity for each neuron is simulated and converted into calcium ([C]), bound calcium ([CB]), and fluorescence (F) for a chosen indicator. C: Light propagation model. An optical wavefront corresponding to particular microscope optics is propagated through a simulated scattering volume, generating a spatially changing scattered point-spread function (top, See Sup. Fig. 13) for creating relative intensity masks (bottom). D: Scanning and image formation. The volume, modulated by the simulated activity, is scanned using the output of the light model with motion and noise sources from a model of the light collection, amplification, and digitization process.
