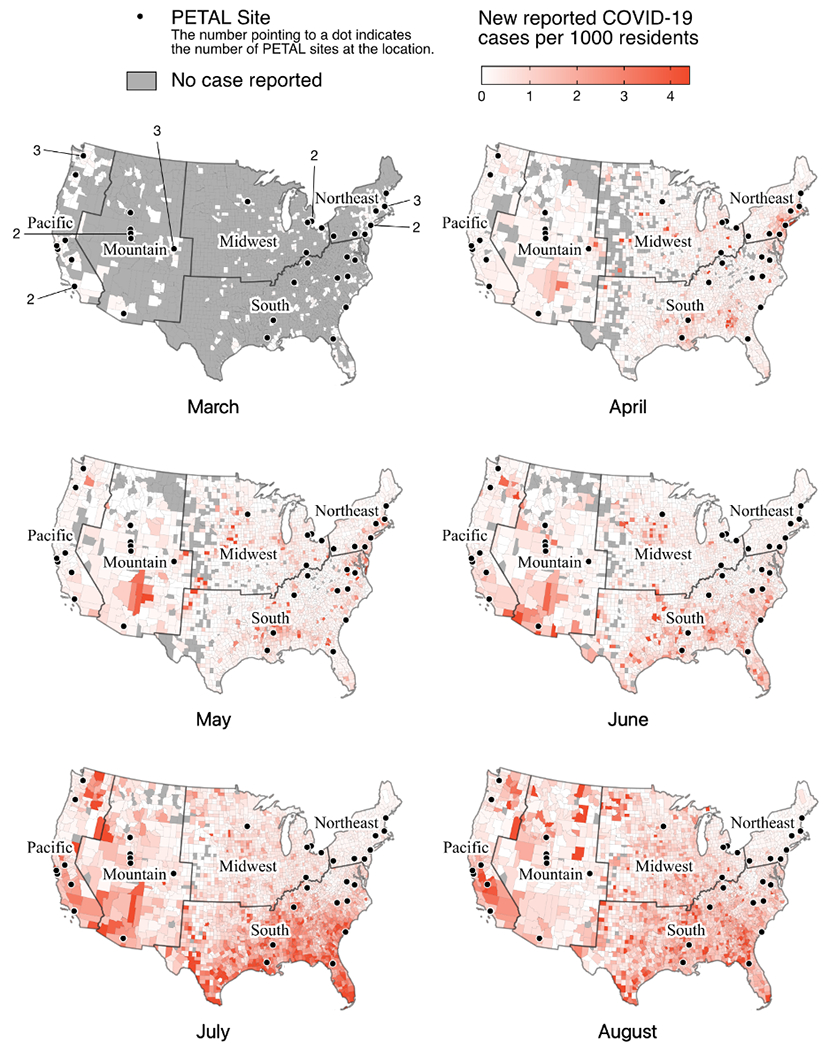
Figure 1: Choropleth map of surveyed hospital locations and county-level case rates of COVID-19 from March through August 2020.

This choropleth map illustrates spatial and temporal variation of weekly county-level COVID-19 cases rates (defined as the absolute number as a percentage of county population). Case rates from the third week of each month are shown in each panel.
