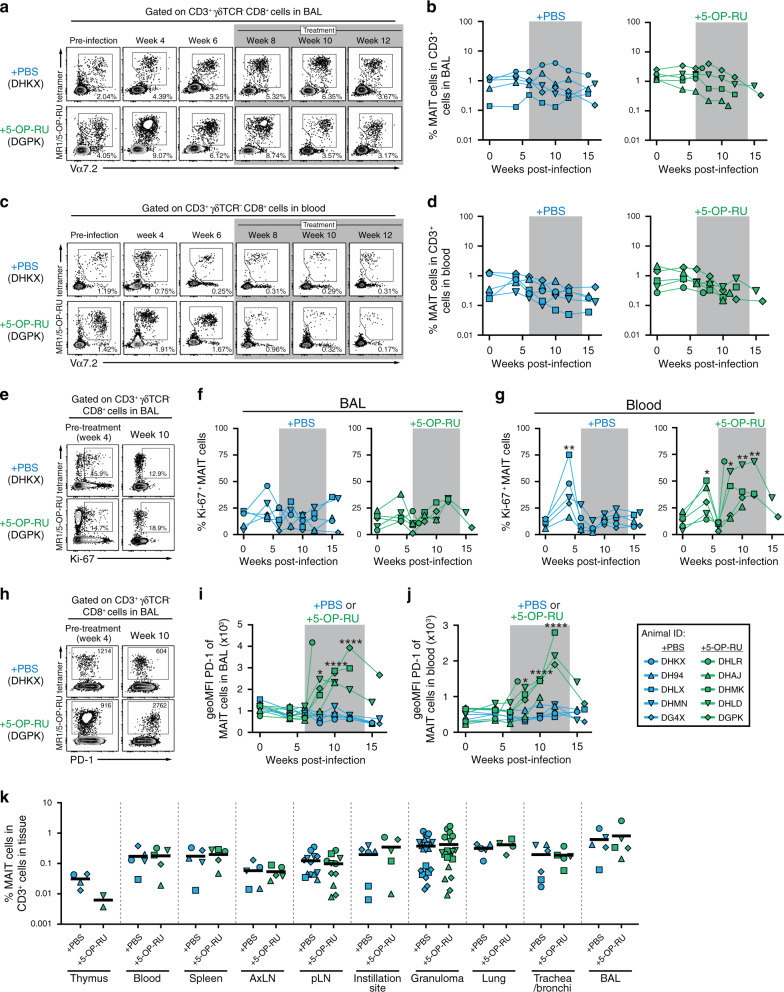
Fig. 3. MAIT cells become activated but do not expand after 5-OP-RU instillation.
a Example FACS plots of MR1/5-OP-RU tetramer staining of cells in the bronchoalveolar lavage (BAL). b Kinetics of the frequency of MAIT cells among CD3+ cells in the airway. c Example FACS plots of MR1/5-OP-RU tetramer staining of cells in the blood. d Kinetics of the frequency of MAIT cells among CD3+ cells in the blood. e Example FACS plots of Ki-67 expression on MAIT cells in the BAL from week 4 and 10 post-infection. Summary graphs showing the percentage of Ki-67+ MAIT cells in the BAL (f) or blood (g). h Example FACS plots of PD-1 expression on MAIT cells in the BAL from week 4 and 10 post-infection. Summary graphs showing the geometric mean fluorescent intensity (geoMFI) of PD-1 on MAIT cells in the BAL (i) or blood (J). K Percentage of MAIT cells in the indicated tissues at necropsy. Each symbol represents an individual tissue sample from indicated animal. *p < 0.05, **p < 0.01, ****p < 0.0001 as compared to the pre-infection time point.

