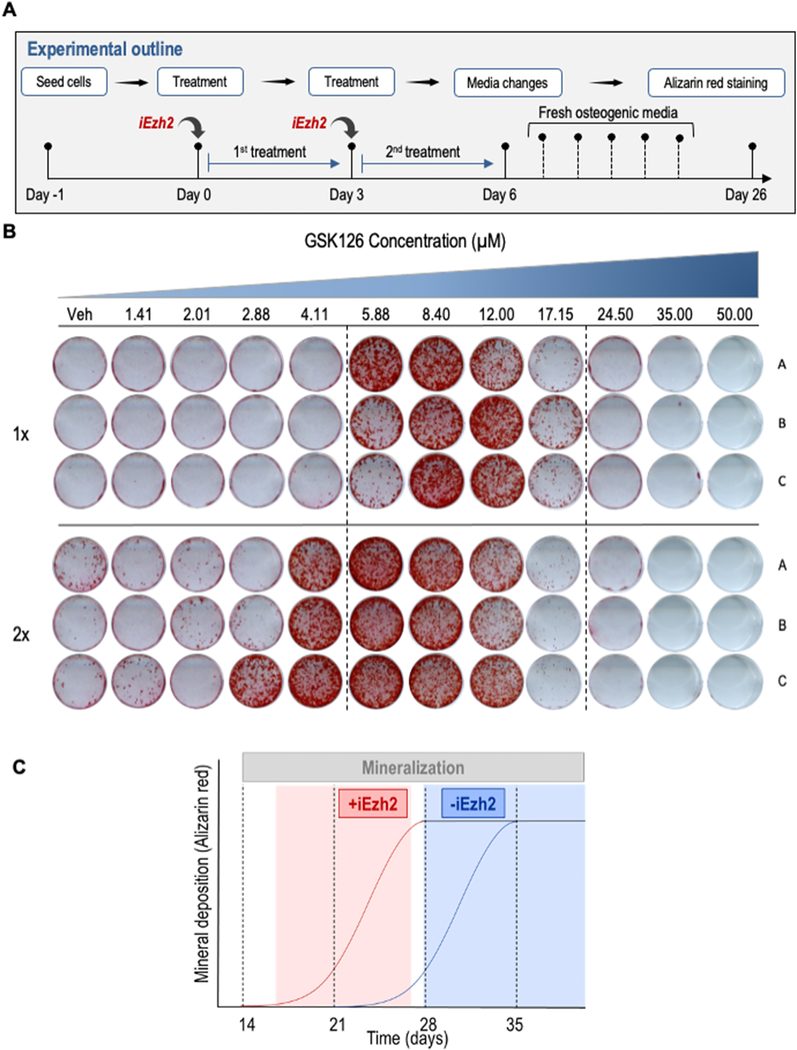
Figure 2: Mineral deposition of MC3T3 cells treated with increasing concentrations of the Ezh2 inhibitor GSK126.
(A) Experimental outline showing the treatment regimens in which MC3T3 cells are treated with vehicle (DMSO, 1:2000 dilution) or Ezh2 inhibitors for three days (1X dose) or six days (2X dose) with increasing concentrations of inhibitor (in 1.5 fold increments). (B) Alizarin red staining of MC3T3 cells treated with either 1X or 2X doses of increasing concentrations of GSK126 at day 26 of osteogenic differentiation (biological triplicates are shown). (C) Hypothetical schematic illustrating the principle of time-dependent (x-axis) variation in the detection of mineralization (y-axis) in the presence (+iEzh2, red) or absence (−iEzh2, blue) of Ezh2 inhibitors. Although all cultures eventually show maximal alizarin red staining (black horizontal slope in graph) after 35 days under our osteogenic experimental conditions, we selected Day 26 for analysis because this time point maximizes the observed differences in mineralization between absence or presence of Ezh2 inhibitors.

