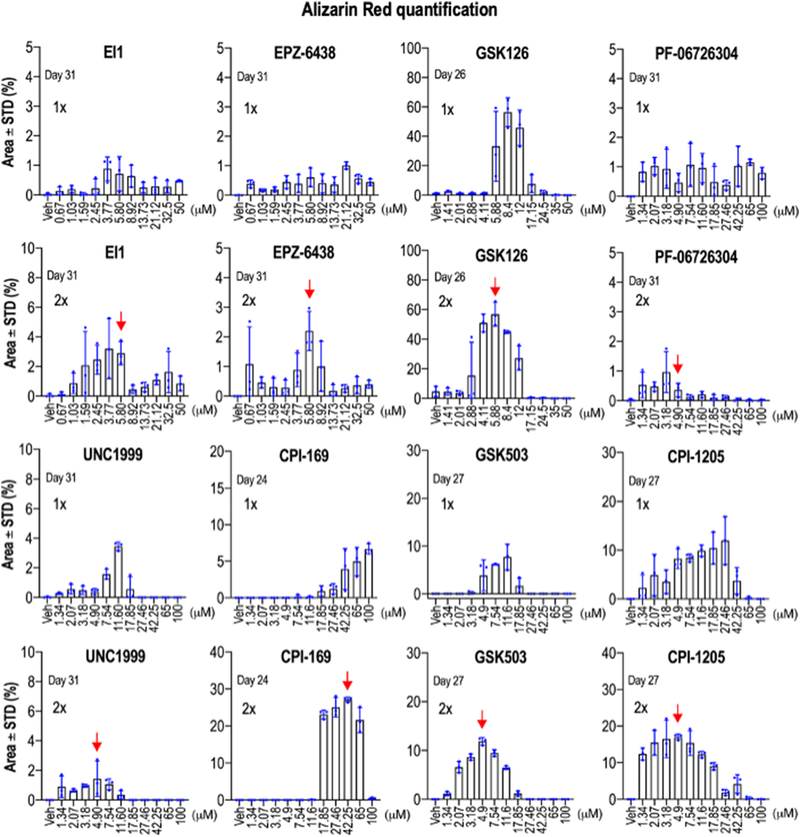
Figure 4: Quantitative analysis of mineralization.
Values for alizarin red staining in cultures of differentiated MC3T3 cells (see Figure 2) are presented as bar graphs. Quantitation is provided for experiments that received either a single dose (1X, Day 0 to 3) or two doses (2X, Day 0 to 3 and Day 3 to 6)(see Fig. 2A). Error bars represent standard deviations of triplicate measurements that are super imposed on the bar graphs. The red arrows point at optimal concentrations (in 2X dose) for compounds that were used in subsequent experiments.

