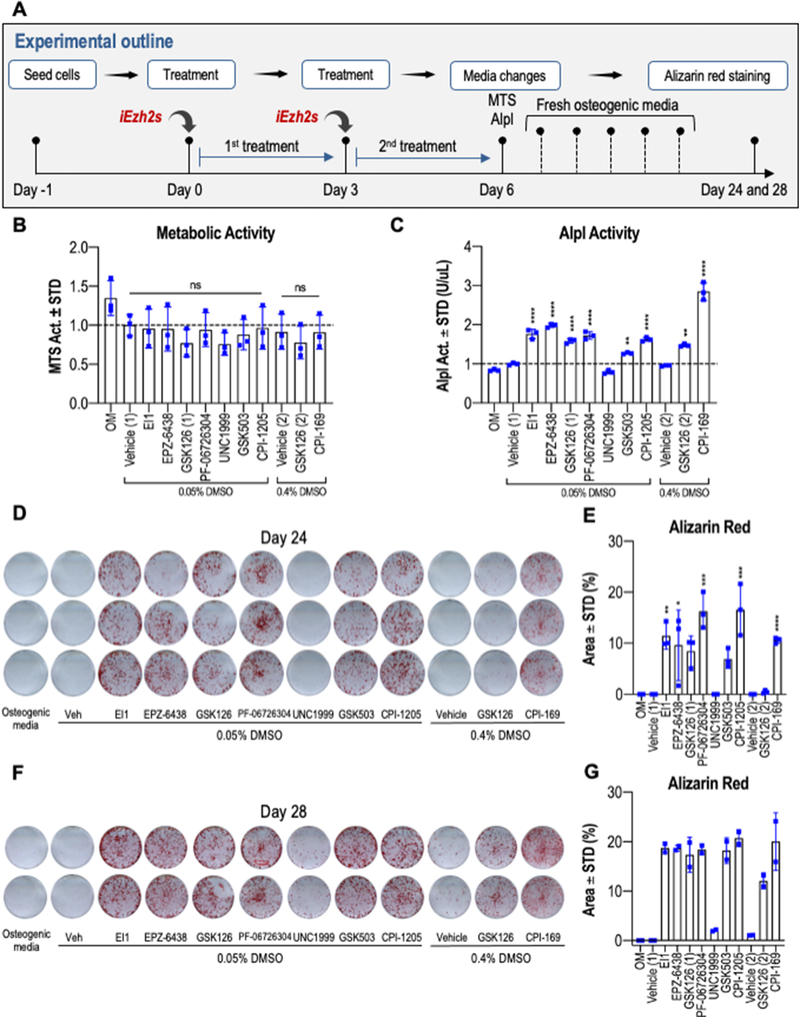
Figure 6: Ezh2 inhibition enhances ECM mineralization on MC3T3 cells.
(A) Experimental outline showing the treatment regimen in which MC3T3 cells were treated with vehicle (Vehicle 1 = 0.05% DMSO or Vehicle 2 = 0.4% DMSO) or optimal doses of each compound (40μM for CPI-169 and 5μM for all other compounds) for the first six days of osteogenic differentiation. GSK126 (1) and GSK126 (2) represent treatments in the presence of either 0.05% or 0.4% DMSO. (B) MTS activity assay of cells treated with either vehicle or Ezh2 inhibitors for six days (n = 3, mean ± STD). (C) Alkaline phosphatase (Alpl) enzymatic activity measured on day 6 (n = 3, mean ± STD). (D–G) Ezh2 inhibition enhances ECM deposition and mineralization in vitro. Alizarin red staining (D, F) and quantification (E, G) was conducted on day 24 (D, E) or day 28 (F, G) of osteogenic differentiation. Each late stage time point was sampled as five biological replicates on two different days to assess the dynamics of mineralization after three to four weeks in culture. For transparency, biological triplicates were performed for day 24 (n = 3, mean ± STD) while duplicates were performed for day 28 (n =2, mean ± range). Duplicates are provided for illustration only. The horizontal lines above the bars (see panel B) reflect statistical comparisons between distinct iEzh2 treatment groups and the respective vehicle controls (i.e., Vehicle 1 = 0.05% DMSO or Vehicle 2 = 0.4% DMSO). In panel B, these values were calculated to be non-significant (ns). Statistical significance for each iEzh2 inhibitor compared to its control (Vehicle 1 or Vehicle 2) is indicated as follows: * p < 0.05, ** p < 0.01, *** p < 0.001, **** p < 0.0001. OM, osteogenic medium.

