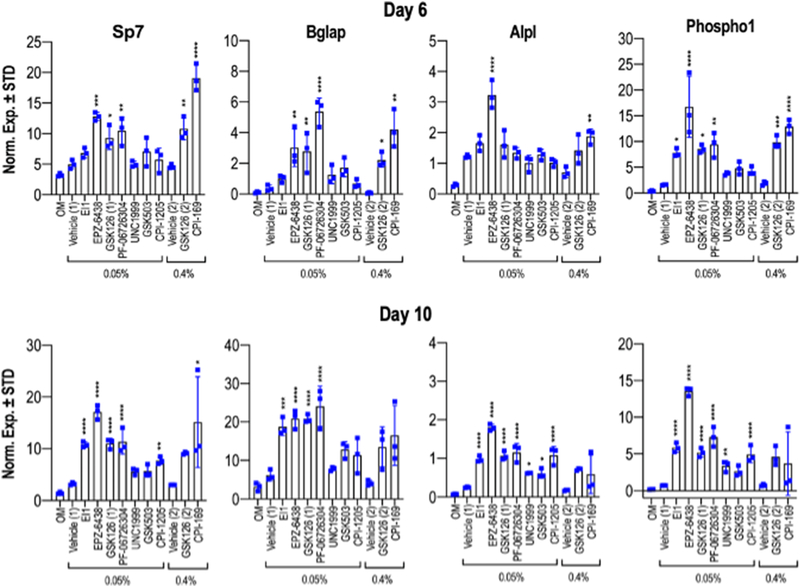
Figure 7: Ezh2 inhibition enhances osteoblast specific gene expression.
MC3T3 cells were treated with vehicle (Vehicle 1 = 0.05% DMSO or Vehicle 2 = 0.4% DMSO) or optimal doses of each compound (40μM for CPI-169 and 5μM for all other compounds) for the first six days of osteogenic differentiation. Graphs showing mRNA expression levels of osteogenic genes determined by RT-qPCR on day six (upper) and day ten (lower) of the osteogenic differentiation timeline (n = 3, mean ± STD). Statistical significance for iEzh2 inhibitor compared to its control (Vehicle 1 or Vehicle 2) is indicated as follows: * p < 0.05, ** p < 0.01, *** p < 0.001, **** p < 0.0001. OM, osteogenic medium.

