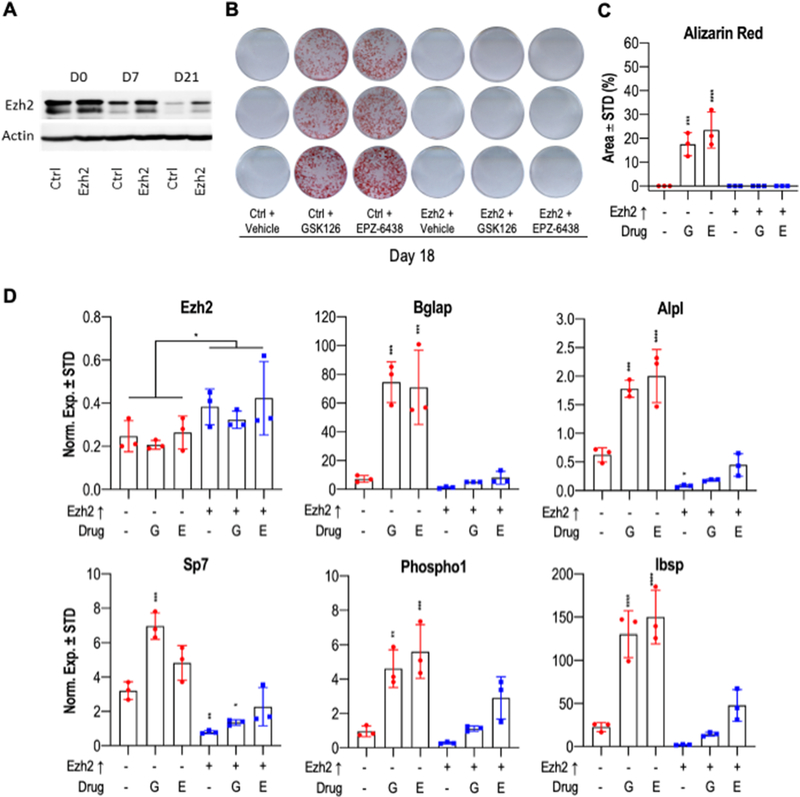
Figure 8: Ezh2 overexpression impairs maturation of MC3T3 preosteoblastic cells.
MC3T3 cells overexpressing Ezh2 were treated with vehicle, 5μM GSK126 or 5μM EPZ-6438 for the first six days of osteogenic differentiation. (A) Western blot analysis showing Ezh2 protein levels over the time course. Alizarin red staining (B) and quantification (C) was performed at day 18 of osteogenic differentiation. Quantification was done using the ImageJ program (n = 3, mean ± STD). (D) Relative mRNA expression of Ezh2 and osteoblast markers in MC3T3 cells after ten days of osteoblast differentiation (n = 3, mean ± STD). The horizontal lines above the bars (see panel D, Ezh2 graph) reflect statistical comparisons between distinct iEzh2 treatment groups and the respective vehicle controls (i.e., 0.05% DMSO or 0.4% DMSO). Statistical significance to Ezh2↑ -, drug - control group indicated as follows: * p < 0.05, ** p < 0.01, *** p < 0.001, **** p < 0.0001. Because samples receiving exogenous Ezh2 expression represents an independent treatment group independent of the presence of iEzh2s, we determined statistical significance of Ezh2 mRNA levels in one group of three sets of samples that was infected with empty lentiviral expression vector (n = 9 total) versus the three experimental groups that express lentiviral Ezh2 (n = 9 total). G, GSK126; E, EPZ-6438.

