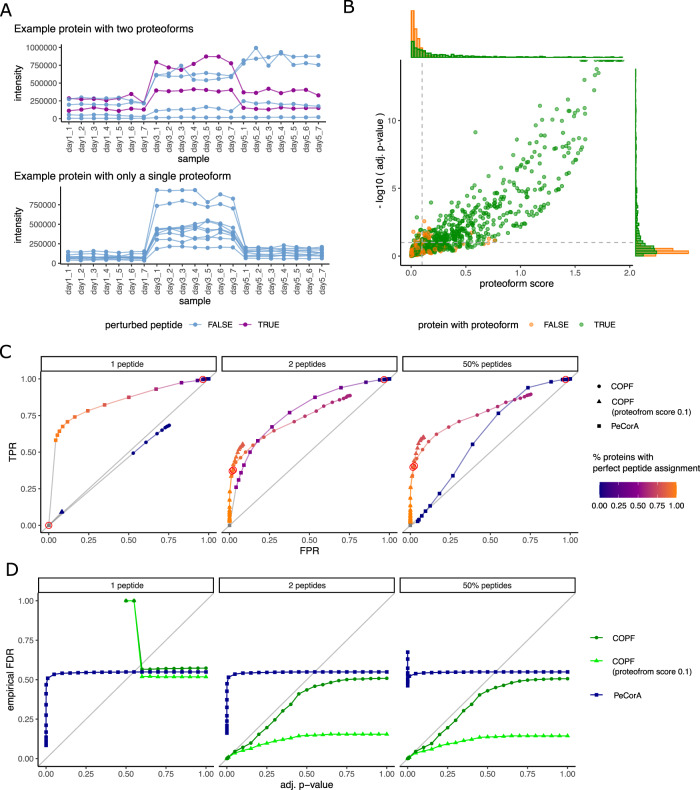
Fig. 2. COPF benchmark.
A We generated an in silico benchmark dataset to evaluate COPF performance. Twenty-one replicate measurements of HEK293 cell lysates derived from the SWATH-MS interlab study19 were selected and adjusted (i) to introduce variance across samples and (ii) to introduce proteoforms for a subset of proteins. The top panel shows the peptide-level intensity profiles for an exemplary protein consisting of two detectable proteoforms (two perturbed peptides in purple). The lower panel shows the peptide-level intensity profiles for a protein consisting of a single detectable proteoform (no perturbed peptides). B Pseudo-volcano plot for proteins with two (green) and only one (orange) proteoform. For this figure, proteoforms were generated by randomly perturbing between two peptides and 50% of the peptides in a protein. C Receiver operator characteristic (ROC) curves for three in silico benchmark datasets. They show the true positive rate (TPR) over the false positive rate (FPR). Individual points in the curve are generated by iterating over different adjusted p-value thresholds. The datapoints derived from an adjusted p-value threshold of 0.1 are highlighted by a red circle. D Empirical FDR values vs. estimated adjusted p-values. Individual points in the curves are generated by iterating over different adjusted p-value thresholds.

