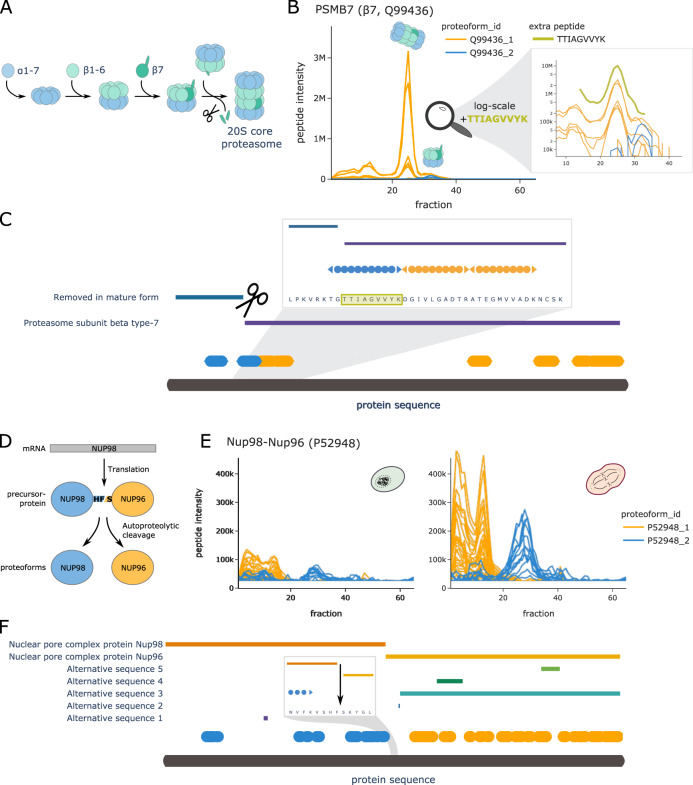
Fig. 4. COPF results for PSMB7 and NUP98/96.
A Schematic overview of the proteasome assembly line. B Peptide profiles of the proteasome subunit-β type-7 (β7, PSMB7, UniProt ID: Q99436) in interphase. Peptides of the two assigned proteoform groups are colored in orange and blue. A zoom-in on fraction 10 to 40 is shown in log scale, including an additional semi-tryptic peptide TTIAGVVYK that represents the N-terminal tryptic peptide of the processed proteoform (green). Please note that the abundance values between the orange and blue peptides cannot be directly compared to the semi-tryptic peptide TTIAGVVYK in green because of the separate analysis platforms used. C Protein sequence plot for PSMB7. Sequence coverage and position of the detected peptides of the two assigned proteoform groups are indicated in blue and orange. Pro-peptide and chain information from UniProt are indicated as horizontal bars. The known pro-peptide cleavage site is indicated by scissors. A zoom-in representation is provided for the region around the annotated cleavage site. The semi-tryptic peptide from B is highlighted in green. D Schematic overview of the NUP98 and NUP96 proteoform biogenesis from the same mRNA and precursor protein (UniProt ID: P52948). E Peptide profiles of the Nup98 gene product in interphase (left) and mitosis (right). Peptides of the two assigned proteoform groups are colored in orange and blue. F Protein sequence plot for the Nup98 gene product. Sequence coverage and position of the detected peptides of the two assigned proteoform groups are indicated in blue and orange. Chain information and alternative sequence isoforms from UniProt are indicated as horizontal bars. The known autocatalytic cleavage site of NUP98/96 is shown as an arrow in a zoom-in on the relevant sequence region.

