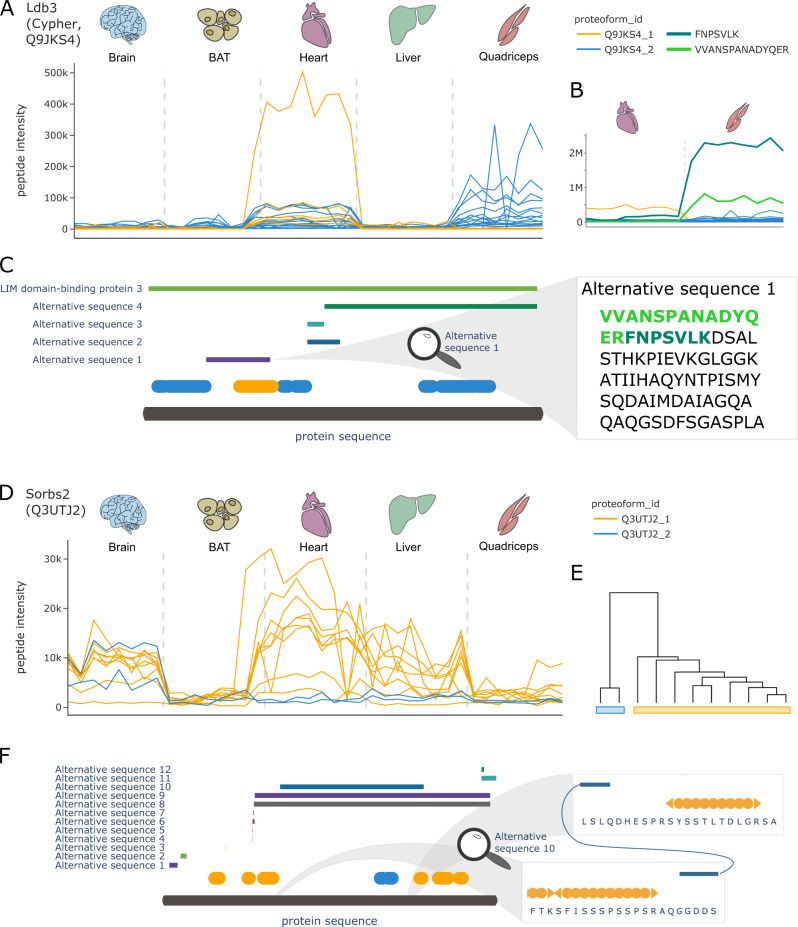
Fig. 7. COPF results for Ldb3 and Sorbs2.
A Peptide profiles of the LIM domain-binding protein 3 (Ldb3, also known as Cypher, UniProt ID: Q9JKS4). Peptides of the two assigned proteoform groups are colored in orange and blue. B Zoom-in on muscle tissue, specifically highlighting two additionally extracted peptides VVANSPANADYQER (light green) and FNPSCLK (dark green) that are specific to the known skeletal muscle-specific splice isoform of Ldb3. Please note that the abundance values between the orange and blue peptides cannot be directly compared to the additionally extracted peptides in green because of the separate analysis platforms used. C Protein sequence plot for Ldb3. Sequence coverage and position of the detected peptides of the two assigned proteoform groups are indicated in blue and orange. Chain information and alternative sequence isoforms from UniProt are indicated as horizontal bars. The zoom-in on alternative sequence 1 shows the sequence of the skeletal muscle-specific splice isoform. The two peptides from B are highlighted in light and dark green, respectively. D Peptide profiles of the sorbin and SH3 domain-containing protein 2 (Sorbs2, UniProt ID: Q3UTJ2). Peptides of the two assigned proteoform groups are colored in orange and blue. E Clustering dendogram for Sorbs2. F Protein sequence plot for Sorbs2. Sequence coverage and position of the detected peptides of the two assigned proteoform groups are indicated in blue and orange. Alternative sequence isoforms from UniProt are indicated as horizontal bars. A zoom-in on the terminal regions of alternative sequence 10 shows that the orange proteoform does not cover this sequence region.

