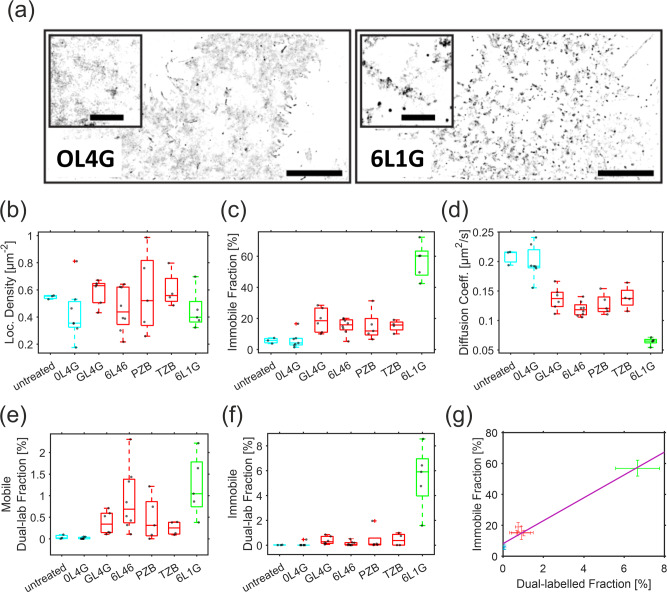
Fig. 6. Lockdown and oligomerization of HER2 diffusion as resolved by single-molecule localization microscopy.
a Representative SMLM super-resolution images rendered from 500 consecutive frames (localization precision ~20 nm) with localization densities encoded as gray values. Scale bar: 10 µm. Magnified center regions are shown as insets (scale bar: 2 µm). b Particle densities in the DY-649 channel observed in different single-molecule experiments. c, d Comparison of the immobile fraction identified by spatiotemporal clustering analysis (c) and the diffusion coefficient within the mobile fraction (d) for HER2 for different treatments. e, f Colocalized HER2 molecules in the mobile (e) and the immobile fraction (f) quantified by dual-color co-tracking. g Correlation of the total fraction of co-localized molecules with the immobile fraction and linear regression (R2 = 0.97, Pearson’s r = 0.99, p = 3.5 × 10⁻⁵). Different colors (cyan, control or monovalent; red, homo-bivalent; green, biparatopic) in b–g indicate the three distinct groups of agents as referenced in the main text. The DARPins are shown schematically in Supplementary Fig. 1. Significance values for b–f are provided in Supplementary Fig. 4.

