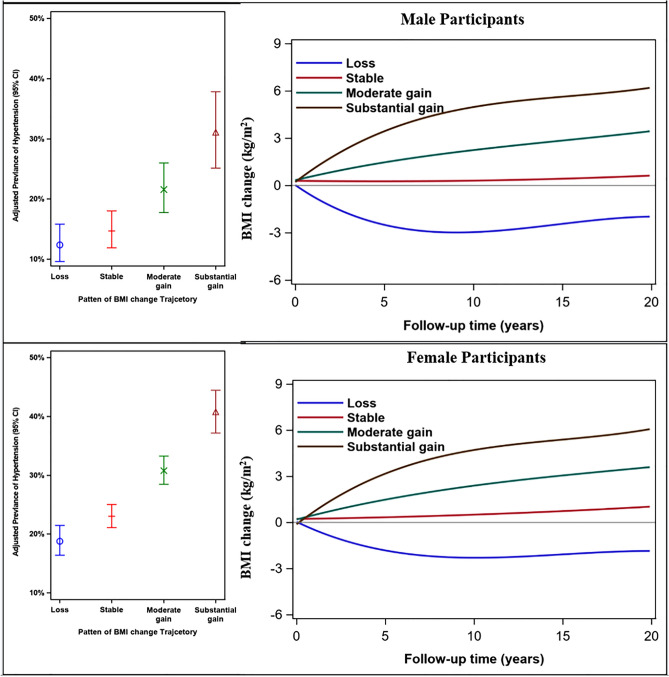
Figure 1.
The probability of hypertension by BMI change trajectories across gender. Expected percentage (95% confidence interval) with elevated hypertension are presented from left to right corresponding to the relative level of BMI change in the color-matched trajectory. For ease of interpretation, BMI substantial gain trajectory are presented in brown, moderate gain in green, stable trajectory in red and BMI loss trajectory in blue. BMI indicates body mass index.

