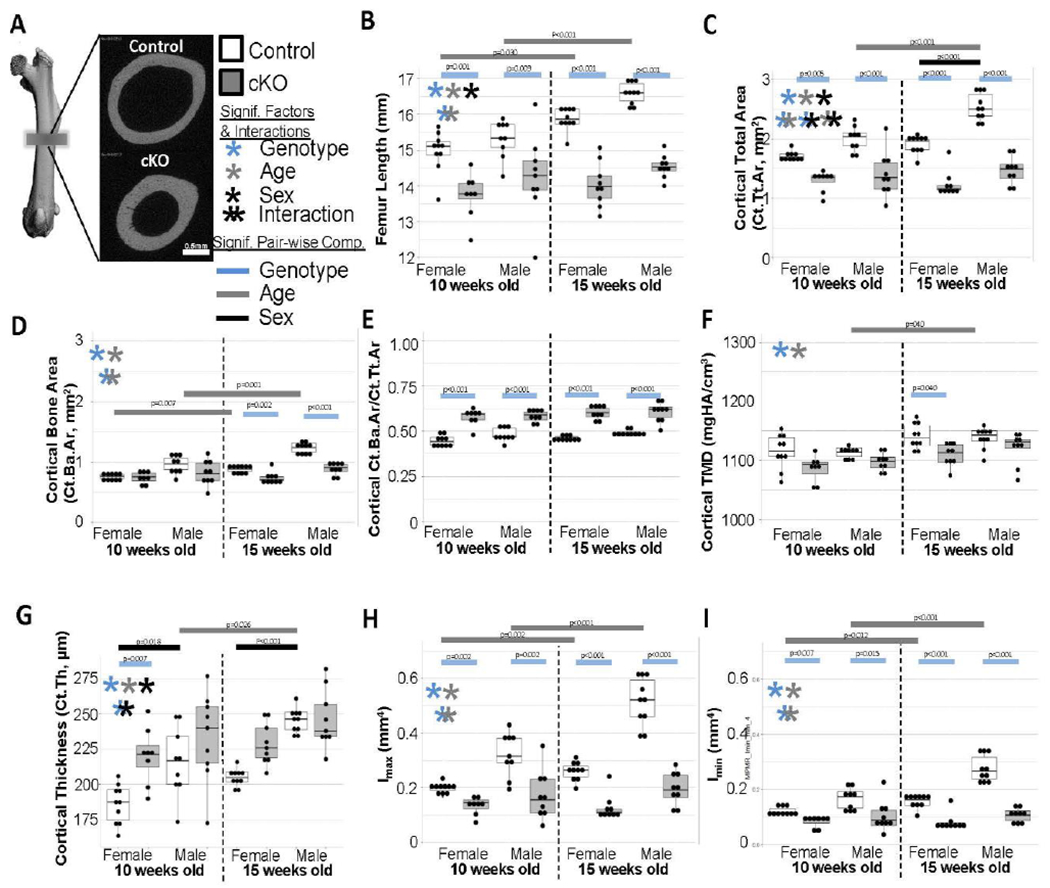
Figure 3. Medium Resolution MicroCT Results.

(a) Examples of midpoint morphology from control and cKO femora. (b) Femora were significantly shorter in cKO bones and did not lengthen as expected between the ages. (c) Similar deficits in total cross-sectional area and growth were observed. (d) Bone area had similar but less dramatic trends. (e) Ultimately, bone volume fraction was significantly increased for cKO in all groups. (f) Generally TMD was reduced in cKO bones. (g) As observed in panel A, cortical thickness was generally increased in cKO bones. (h,i) As expected with the smaller geometry, moments of inertia were reduced in cKO bones of all groups and did not increase with aging.
