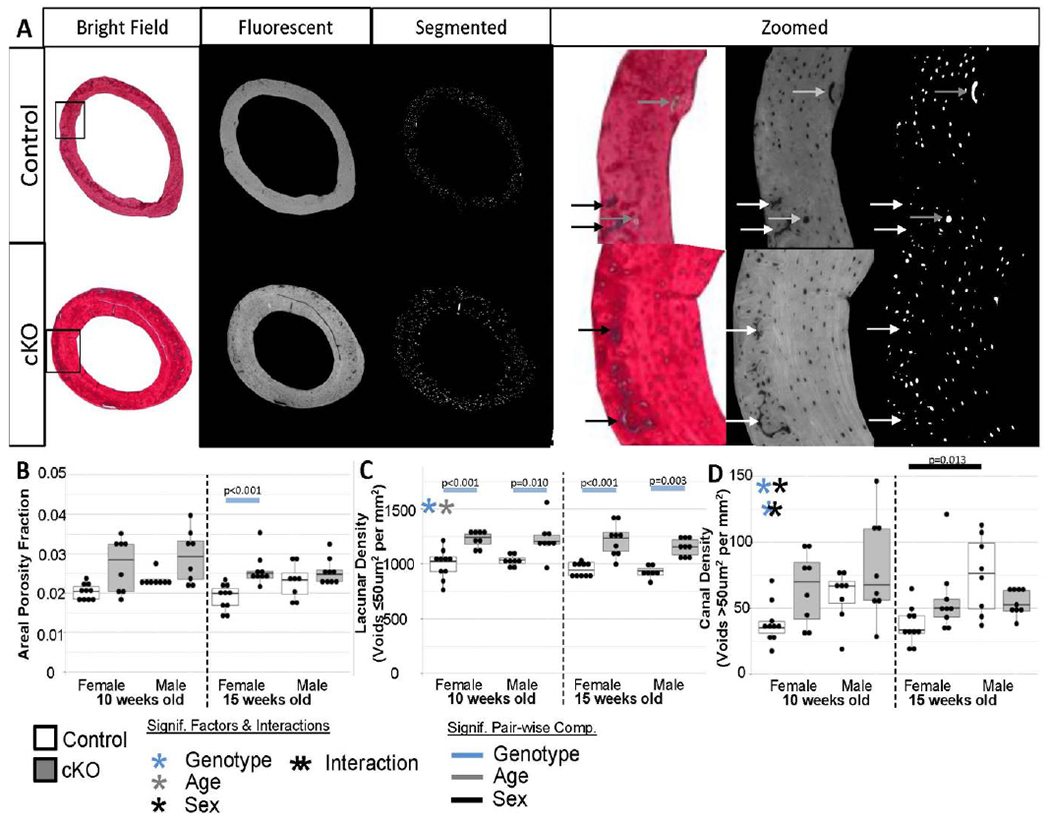
Figure 6. Fluorescent Light Imaging Results.

(a) Examples of sections imaged under fluorescent light to accentuate void areas. Calcified cartilage (black/white arrows), which is common in remnant woven bone bands, appeared as void spaces so were manually excluded from analysis. Larger canals (grey arrows) were included. (b) Overall areal porosity was not different between most groups. Although analysis as a whole was not possible due to the skewness of the data. This could also be a reflection of sectioning bias not capturing large canals well, which would constitute a large amount of the volumetric space. (c) Lacunae-scale void density was higher in all cKO bones which matched well the increase in cell nuclei. (d) Canal-scale void density was generally higher in cKO bones as observed in the high resolution microCT 3D reconstructions.
