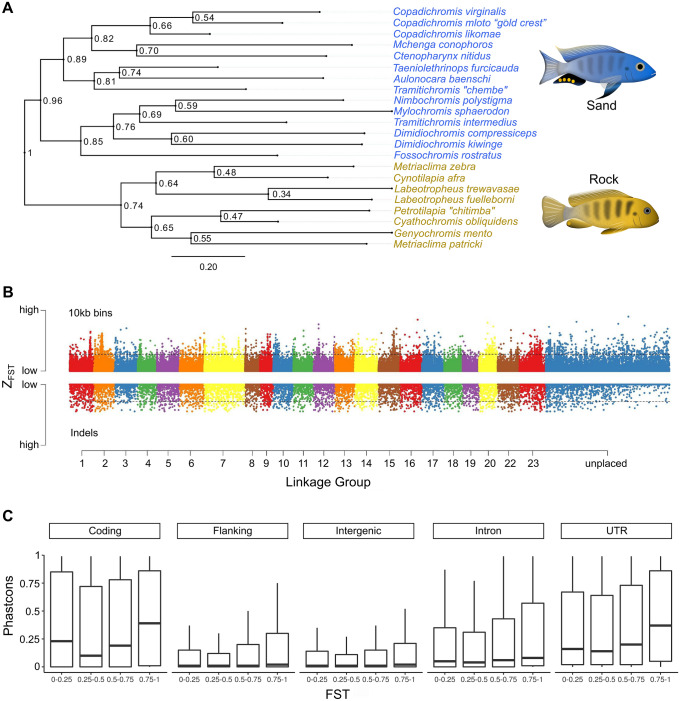
Figure 1.
The genomic substrate for rock vs. sand evolution. (A) A maximum likelihood phylogeny of eight rock- and 14 sand-dwelling species, based on variable sites (informative SNP and InDels) identified throughout the genome. “Sand” species contain representatives of the lineages “shallow benthic, deep benthic and utaka” from Ref.32, while the “rock” species correspond to the “mbuna” lineage. (B) A plot of Z-FST (FST normalized using Fisher’s Z-transformation) across the genome (ggplot2 v3.3.3https://ggplot2.tidyverse.org/), plotting genomic divergence between rock- vs. sand-dwelling groups. Single nucleotide polymorphisms (SNPs) summed over 10 kb bins and insertion-deletion mutations (InDels) are shown on the same scale. Numbers along the x-axis refer to linkage groups (i.e., chromosomes) and threshold lines indicate 2.5% FDR. (C) Evolutionary conservation (PhastCons) scores were calculated for each nucleotide across the genome, subdivided by genome annotation and plotted by bins of increasing FST. The PhastCons score for each genome category is significantly higher for increasing bins of FST (pairwise Wilcoxon rank sum p value < 2e−16 for each pair of bins).

