Figure 2.
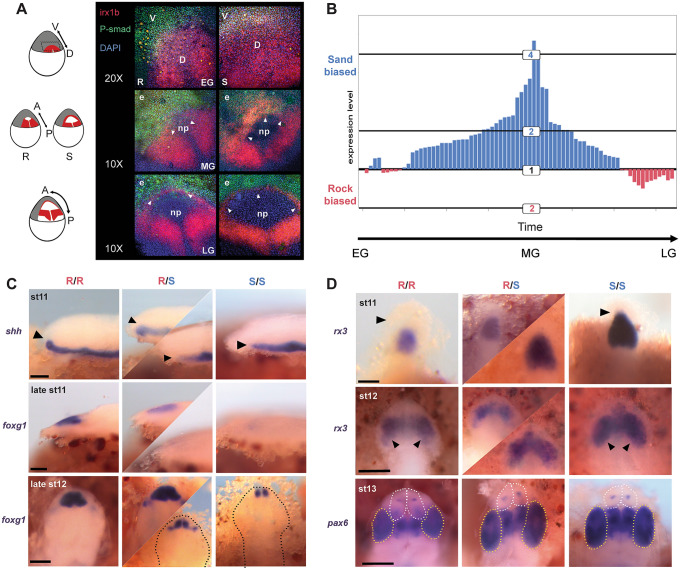
A gastrula-stage map of forebrain diversification. (A) Double in situ hybridization—immunohistochemistry to visualize irx1b expression (red) and BMP [PSMAD] activity (green) across the stages of cichlid gastrulation; DAPI in blue. Three rows represent early, mid and late gastrulation (EG, MG, LG) in embryos of rock- (R) and sand-dwelling (S) species. Sand-dwellers show expanded irx1 expression in the dorsal portion of the embryo at EG, expanded irx1b expression in the anterior domain at MG (arrowheads) and clear PSMAD activity from the developing neural plate (np) earlier in LG (arrowheads). e epidermis. Schematics at left show irx1b expression domains in red, on cartoons of cichlid embryos. (B) Relative expression of rock (red) and sand (blue) irx1b alleles, sampled from 74 heterozygous rock-X sand-F2 embryos, across the stages of gastrulation. F2 embryos were sampled at stage 9 (gastrulation). Because Malawi cichlid species are maternal mouthbrooders and eggs are fertilized in batches per brood, each brood’s embryos vary in timing of fertilization by up to 4 h. Embryos within broods can therefore be sub-staged in gastrulation (see “Materials and methods” section). Each bar on the plot represents the relative allelic expression of sand- and rock-irx1b in a heterozygous F2 individual. Quantification of allele-specific expression (ASE) shows that levels are sand-biased, and that this effect is strongest in MG. (C) In situ hybridization of shh and foxg1, during neurula stages, showing development of the telencephalon in rock-X sand-F2 embryos, indexed for irx1b genotype. F2 individuals homozygous for rock-irx1b alleles (R/R) show a more dorsal progression of shh expression (black arrowheads), an earlier and a larger expression domain of the telencephalon marker foxg1. The top two rows are lateral views; bottom row is a dorsal view. Dotted lines demarcate the outline of the embryo in dorsal view. Heterozygous individuals exhibit greater variation in expression domains (middle columns), indicating that genetic factors other than variants in irx1b contribute to this phenotype. (D) In situ hybridization for rx3 and pax6, during neurula stages, chart the development of the eye field in rock- X sand- F2 embryos indexed for irx1b genotypes. F2 individuals homozygous for sand-irx1b alleles (S/S) show larger domains of rx3 (black arrowheads) and larger eyes (pax6, also marked by yellow dotted line), but smaller telencephala (white dotted line). All panels are dorsal views. Heterozygous individuals exhibit greater variation in expression domains (middle columns), indicating that genetic factors other than variants in irx1b contribute to this phenotype.

