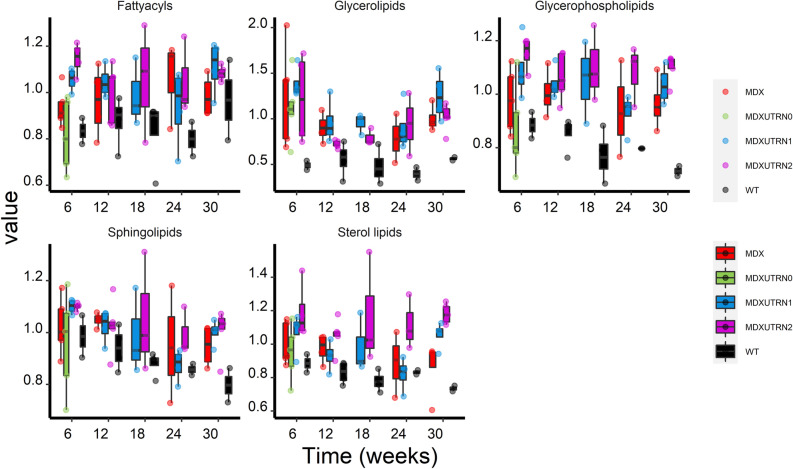
Figure 2.
Analysis of lipid families over time in WT, mdx and mdx utrophin mice. Box plots showing the progression of each lipid family over the 30 weeks observational time. The cumulative levels of each lipid family (sum of all lipids belonging to the class) are plotted on the y axis for fatty acyls, glycerolipids, glycerophospholipids, sphingolipids and sterol lipids. Mdx mice are plotted in red, WT in black; mdx mice with 0, 1 and 2 functional utrophin alleles are plotted in green, blue and pink, respectively.

