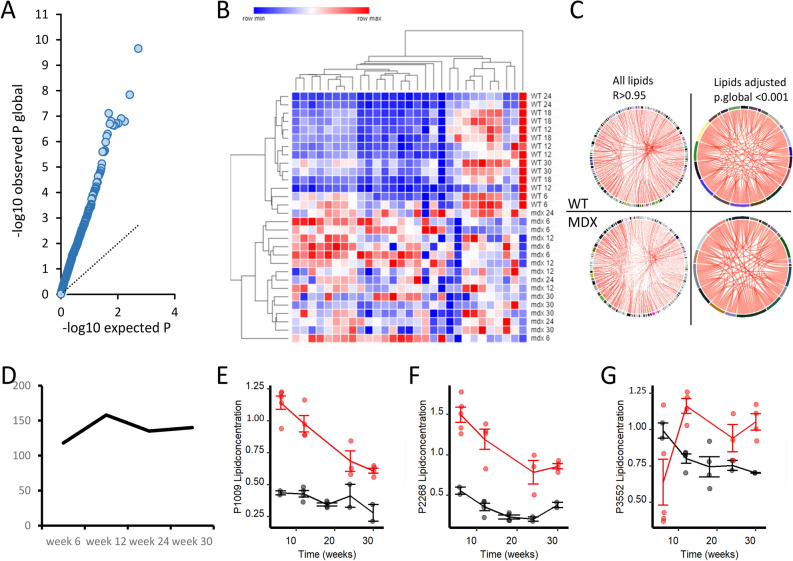
Figure 3.
Analysis of individual lipid trajectories in mdx and WT mice. (A) Scatter plot showing the enrichment in low P values in the observed distribution compared to the expected one. (B) Heatmap showing the abundance of 29 lipids with adjusted P.global < 0.001. Hierarchical clustering shows complete separation of dystrophic and WT animals. (C) Circular plots showing the correlation across all lipids and the 29 selected lipids in both WT and mdx mice. Despite the difference in abundance, the correlation across the lipids was maintained. (D) Plot showing the number of lipids significantly dysregulated at each time point in mdx mice. At 12 weeks of age the highest number differences was recorded. (E–G) Line plots showing the differences for 3 specific lipids at all time points.

