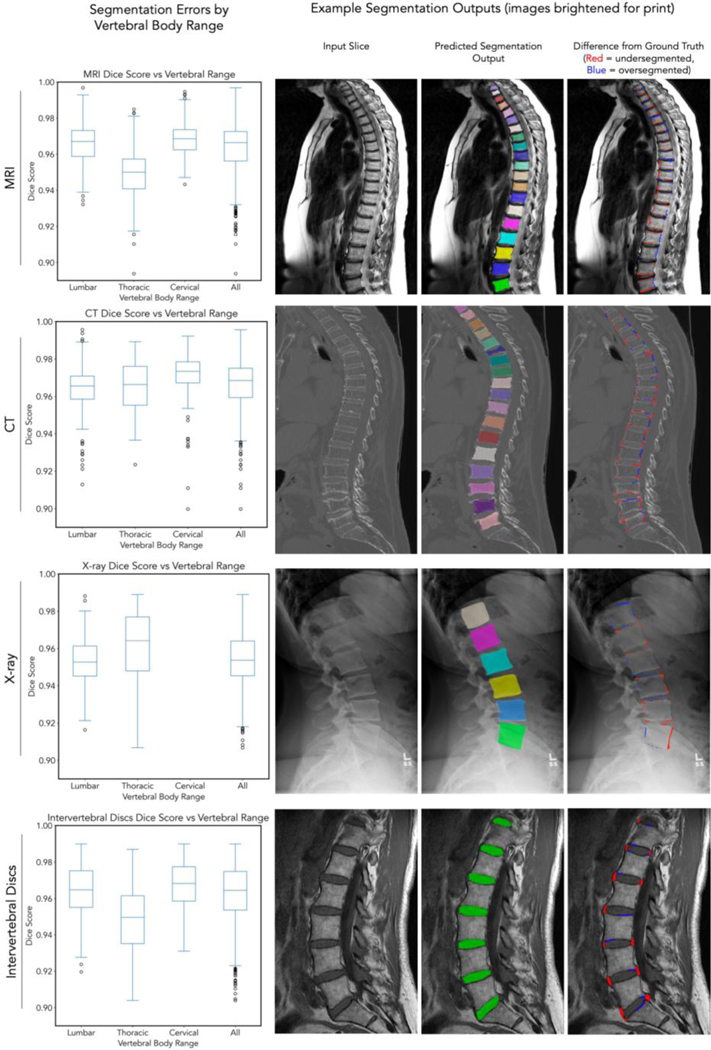
Figure 3: Segmentation results.
For each row, left pane corresponds to Dice score for that imaging modality across individual vertebral bodies (C1, C2 excluded because of absence from testing set). Box and whisker plots show median, 25th-75th percentile range and 1.5x IQR + outliers. Right three panels correspond to an input image, output of segmentations from the network evaluated on testing images (note the different colors that designate individual vertebral bodies as separate entities), and a difference map highlighting where segmentations differ from ground truth manually annotated for the input image. We highlight that these images contain some of the best (e.g. X-ray: cyan vertebral body DSC 0.99) and some of the worst segmentations (e.g. CT: dark purple vertebral body DSC 0.91) in our network. Supplemental Figure 2 contains vertebra-by-vertebra and intervertebral disc Dice scores. Data visualized is from fold 3.

