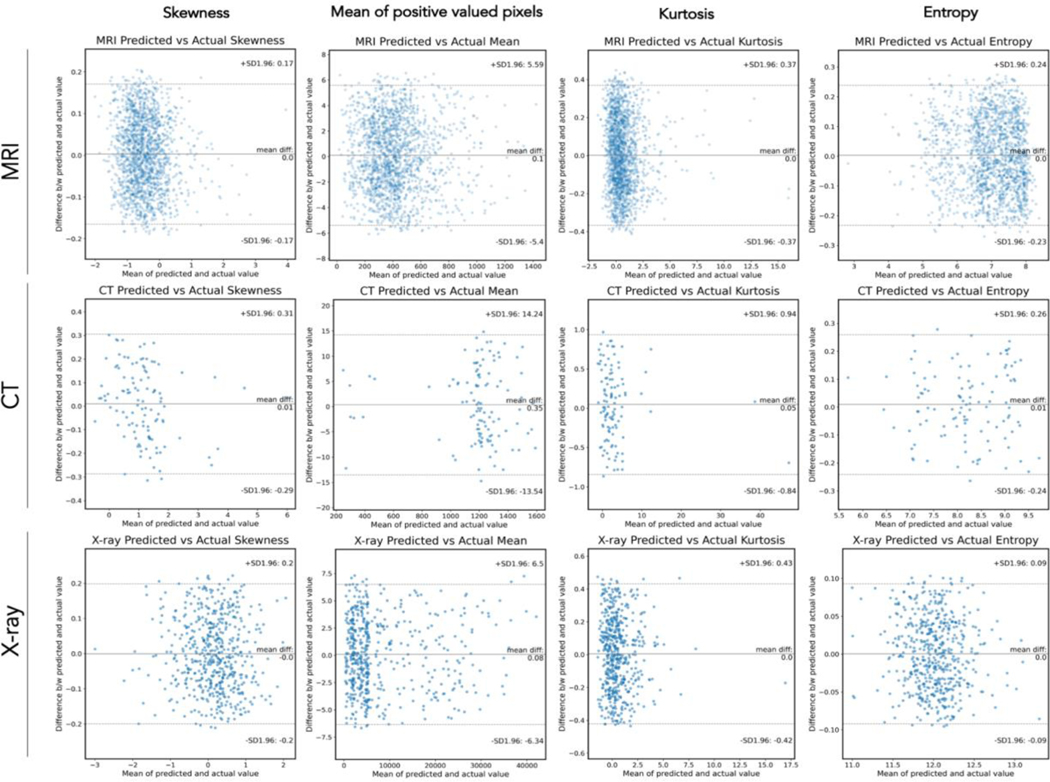
Figure 4: Agreement Results for Radiomics Measurements.
For each modality (MR, CT, X-ray; rows) and each radiomic feature (skewness, mean of positive valued pixels, kurtosis, entropy), a Bland-Altmann plot is pictured to display agreement data. Central line = mean difference. Dashed upper and lower lines indicate ± 1 SD. X axis is mean of actual and predicted value, Y axis is difference between mean and predicted value.

