
Figure 1.
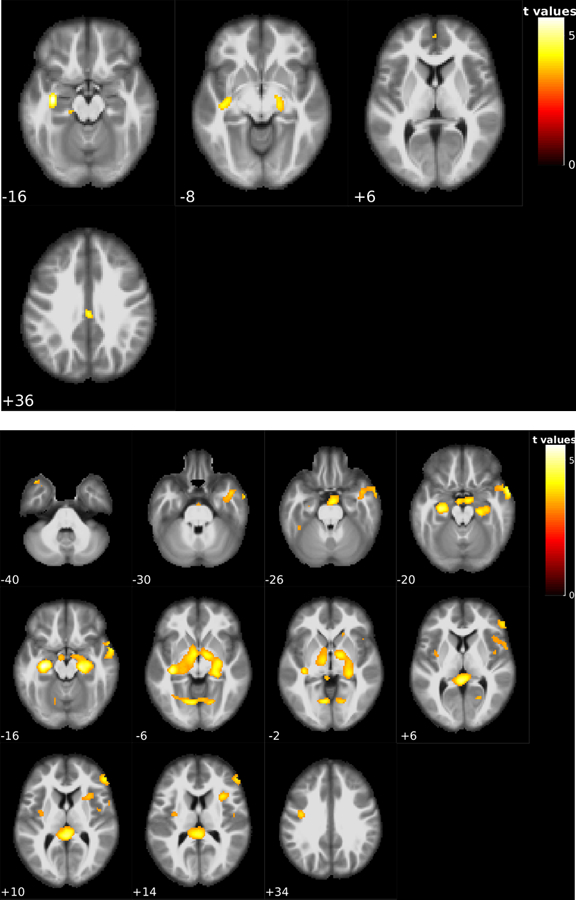
Voxel-wise statistical analysis results of the within-subject CBF changes in patients with no change of disease status at both assessed time points. CBF changes were marked with the red clusters. Figure 1-A is the longitudinal CBF reductions in the 20 non-converter NC subjects; significant CBF reduction was found in the left and right hippocampus and left fusiform gyrus. Figure 1-B shows the longitudinal CBF reductions in the 57 non-converter MCI patients; significant reduction of CBF was found on left and right hippocampus, left and right cerebellum, basal ganglia, and left fusiform gyrus. The number underneath each image slice indicate the slice location in the MNI standard brain space.