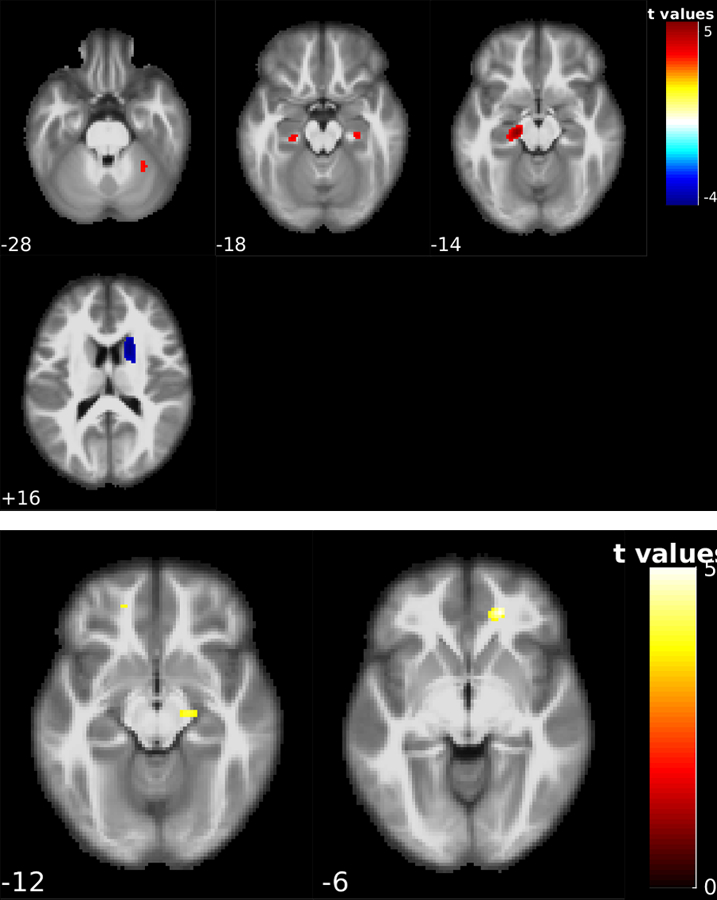
Figure 2:

Voxel-wise statistical analysis results for the converter groups. Figure 2-A shows the CBF change patterns in the 21 NC to MCI converters; significant reduction of the CBF was found on the left and right hippocampus, right cerebellum, and an increase in CBF in the right putamen and right caudate nucleus. Figure 2-B shows the CBF change patterns for 17 MCI to AD converters; significant CBF reduction was found in the right hippocampus and right superior orbital gyrus. The number underneath each image slice indicate the slice location in the MNI standard brain space.
