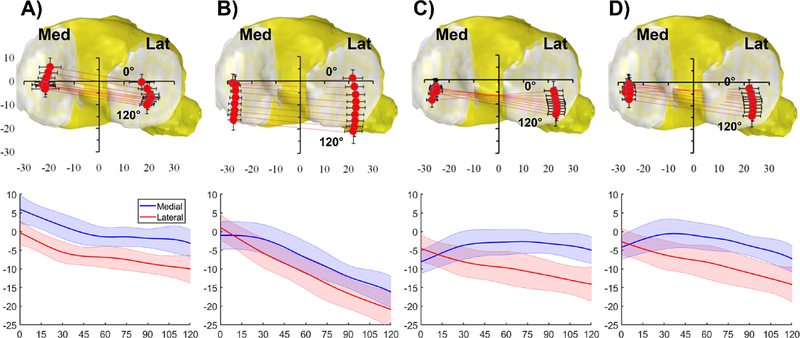
Fig. 4.
Comparison of the motions of the medial and lateral femoral condyles using (A) articular contact points, (B) TEA, (C) GCA, and (D) IHA axes during the knee flexion. For each motion description, the upper plots graphically present the medial and lateral femoral condyle motions projected onto the tibial plane. The contact points / axis end points of the medial and lateral condyles at each flexion angle are connected by straight lines. The vertical and horizontal bars represent ± one standard deviations of the anteroposterior and mediolateral location measurements. The lower plots quantitatively describe the anteroposterior locations of the medial and lateral femoral condyles from 0° to 120° of flexion using different motion descriptions. The shaded bands represent ± one standard deviation.

