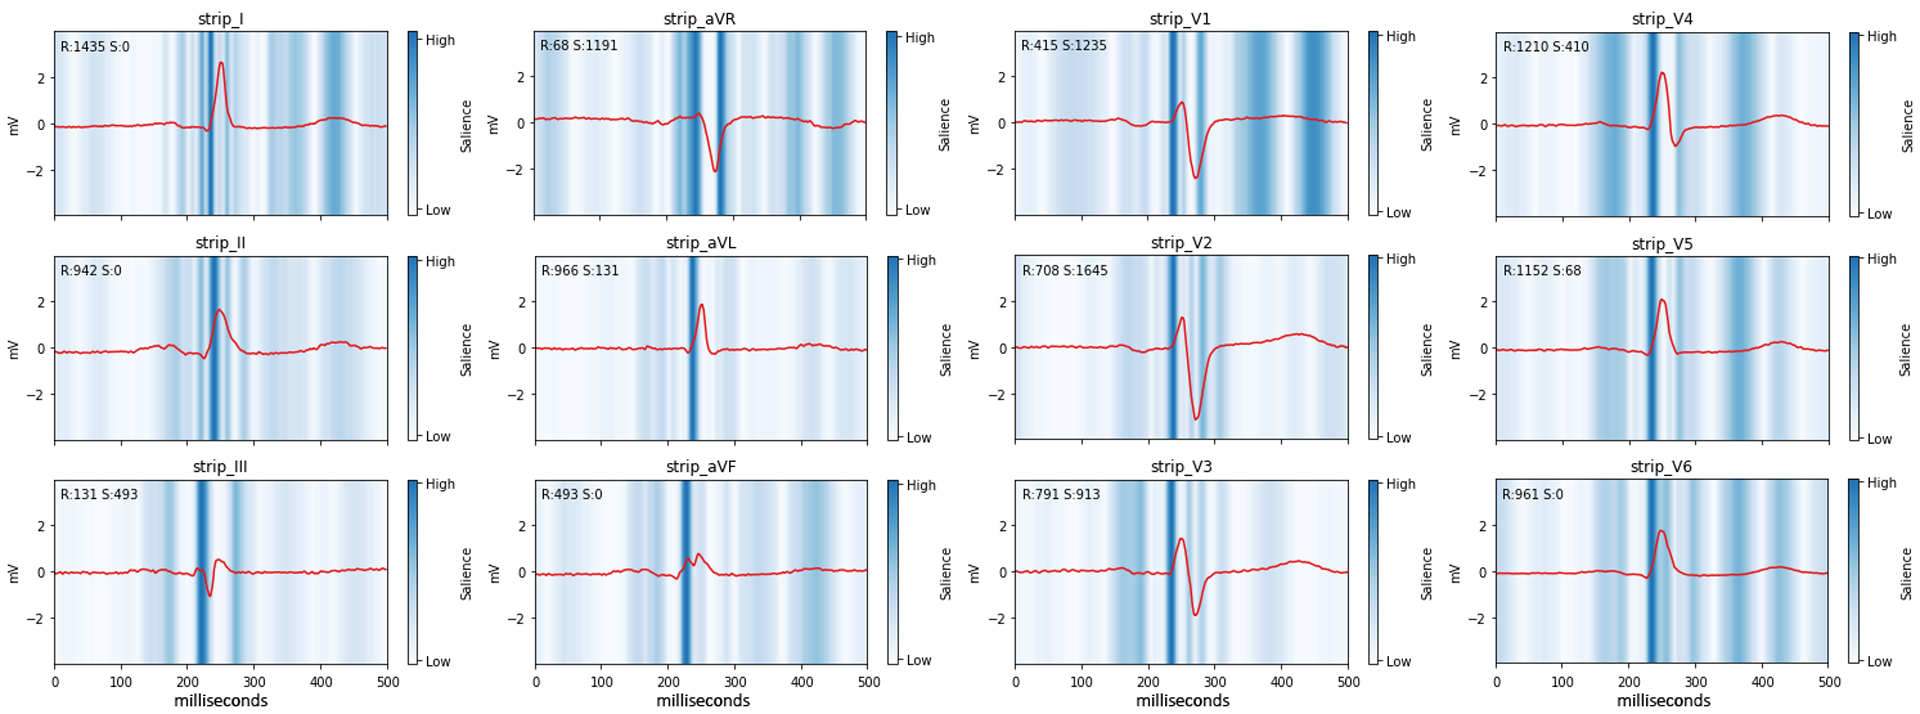
Figure 4.

LVM-AI saliency maps
Depicted is a 12-lead ECG tracing and saliency map from a single individual correctly classified by LVM-AI as having LVH despite not meeting any ECG-based LVH rules. The red waveform is the individual’s ECG tracing. Blue shades depict the magnitude of the gradient of predicted LV mass with respect to the ECG waveform amplitude, where darker shades illustrate regions of the waveform exerting greater influence on predicted LV mass. Measured R and S wave amplitudes (μV) are depicted on the top left of each plot.
