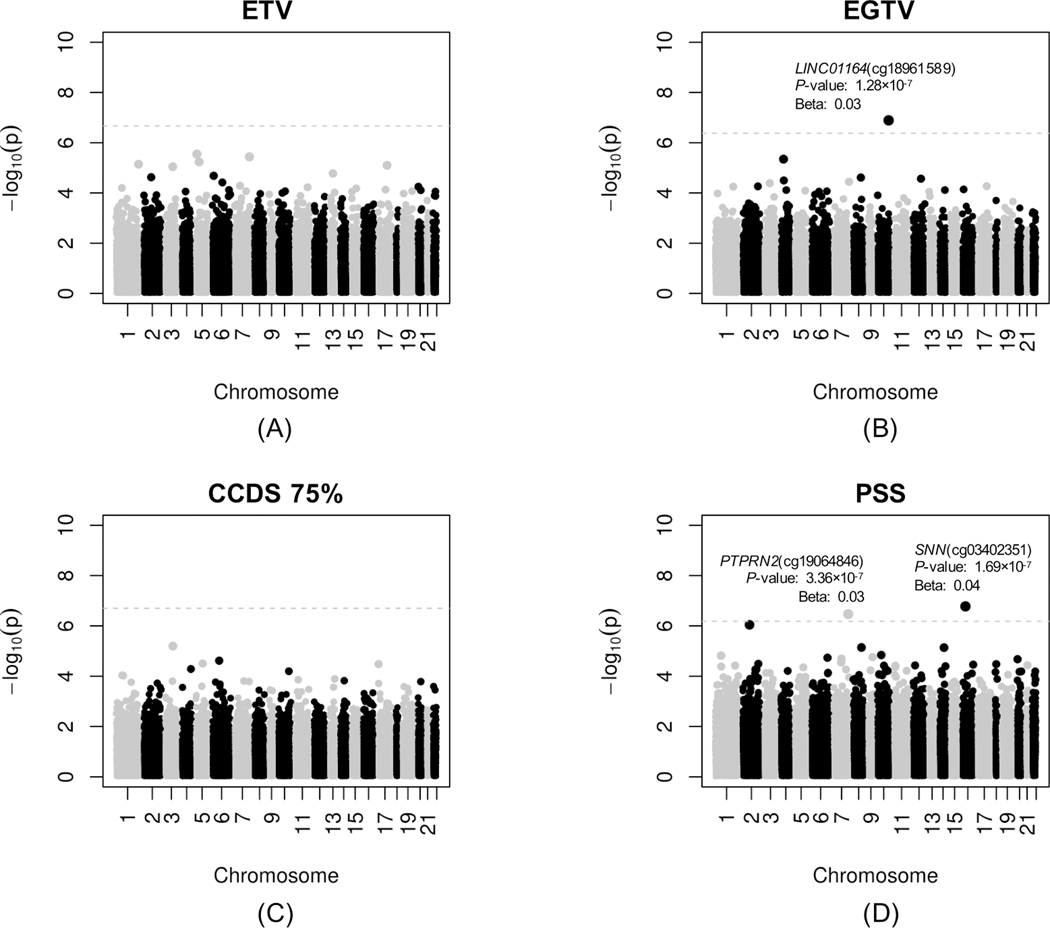
Figure 2. Manhattan plots for the epigenome-wide association studies (EWAS) of four ETV/stress measures in nasal epithelial samples from participants in the Epigenetic Variation of Childhood Asthma in Puerto Ricans study (EVA-PR).

(A) Exposure to Violence scale (ETV), (B) Exposure to gun violence (ETGV), (C) Checklist of Child Distress Symptoms (CCDS), and (D) maternal perceived stress symptoms (PSS). The chromosomal position of each CpG site is displayed along the X-axis and the negative logarithm of the association P-value is displayed on the Y-axis. The dotted line represents the threshold for genome-wide significance line (false-discovery rate-adjusted P < 0.05).
