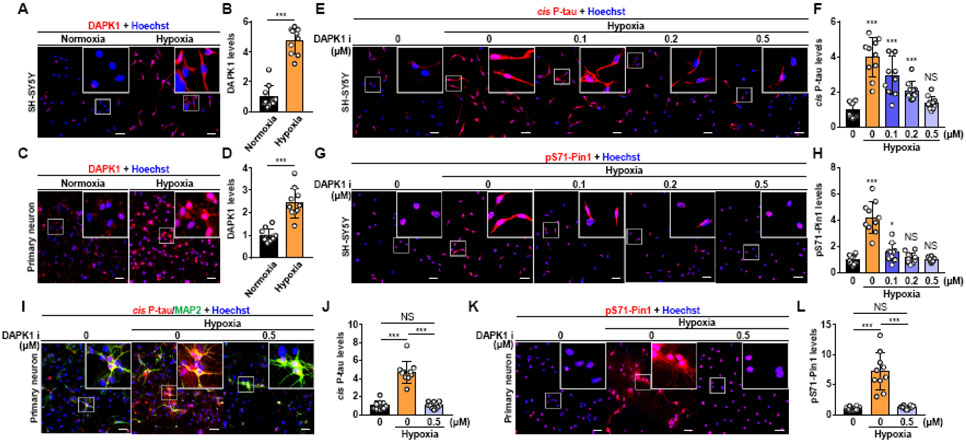
Fig. 6. Cis P-tau is induced in stressed neurons and blocked by a DAPK1 inhibitor.
A-D. SH-SY5Y cells were cultured without serum and placed in a 0.5% hypoxia chamber for 48 h (A). Primary neurons derived from the cerebral cortex of early postnatal (P0-P1) mouse brains at DIV 10-12 were treated with 0.5% hypoxia (C). DAPK1 expression was detected by immunofluorescence (A, C), and DAPK1 expression was quantified (B, D). DAPK1, red; DNA, blue; p-values were calculated using two-tailed Student’s t-test. E-H. SH-SY5Y cells were pretreated with several doses of a DAPK1 inhibitor in the absence of serum for 48 h, and the cells were then treated with hypoxia for 48 h in the absence and presence of the DAPK1 inhibitor at various doses. The expression of cis P-tau (E) and pS71-Pin1 (G) in the cells was examined by immunofluorescence staining and quantified (F, H). cis P-tau and pS71-Pin1, red; DNA, blue. I-L. Primary neurons were pretreated with a DAPK1 inhibitor at the indicated dose for 48 h, and then, the cells were treated with 0.5% hypoxia for 48 h. Finally, the cells were collected for immunofluorescence (I, K). cis P-tau and pS71-Pin1, red; MAP2, green; DNA, blue. The images of cis P-tau (J) and pS71-Pin1 (L) immunostaining were quantified and analyzed using one-way ANOVA with Tukey’s multiple comparisons test; the results shown are the mean ± SD (***p<0.001, *p<0.05). All experiments are representative of three independent experiments. Scale bar= 50 μm. NS, no significance.

