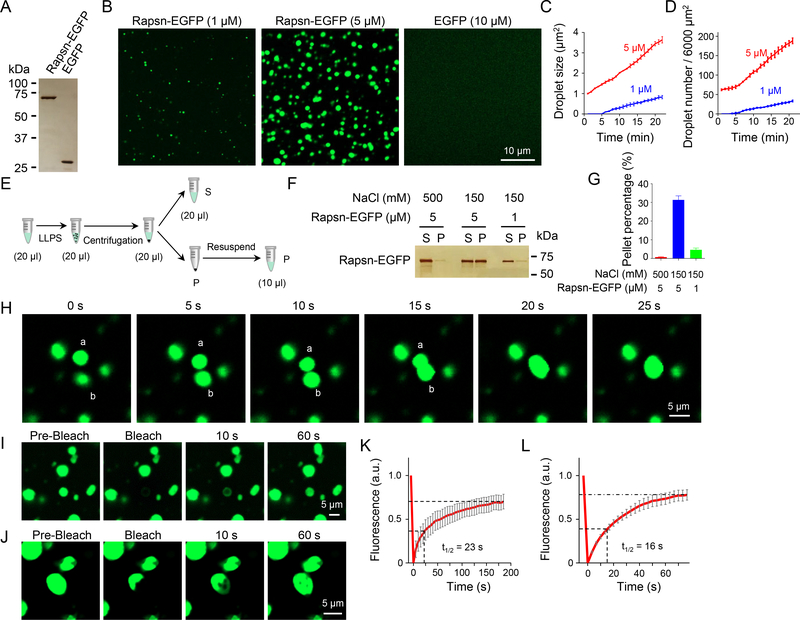
Figure 1. LLPS of Rapsn-EGFP into condensates in vitro.
(A-D) LLPS of Rapsn-EGFP, but not EGFP, into condensed droplets in a concentration-dependent manner. (A) Silver staining showing Rapsn-EGFP and EGFP. (B) Rapsn-EGFP, but not EGFP, was able to phase separate into condensed droplets. Rapsn-EGFP (1 μM and 5 μM) and EGFP (10 μM) were diluted into physiological buffer, and after 20 min, representative images were acquired. (C, D) Quantification of droplet size and number at indicated times.
(E) Schematic diagram showing separation of condensed phase from aqueous phase by centrifugation.
(F) High salt and lower protein concentration reduced the amount of Rapsn in pellets. Shown were representative silver staining.
(G) Quantification of Rapsn-EGFP in pellets in (F). Data was shown as mean ± SEM; n = 3.
(H) Fusion of two Rapsn-EGFP droplets.
(I-L) Rapsn-EGFP in condensed droplets extensively exchanged with surrounding aqueous phase or within droplets. FRAP analysis of a Rapsn-EGFP droplet (I) or a part of droplet (J). (K, L) Quantification of fluorescence recovery in (I, J).
Data was shown as mean ± SEM; n = or > 3.
See also Figure S1.

