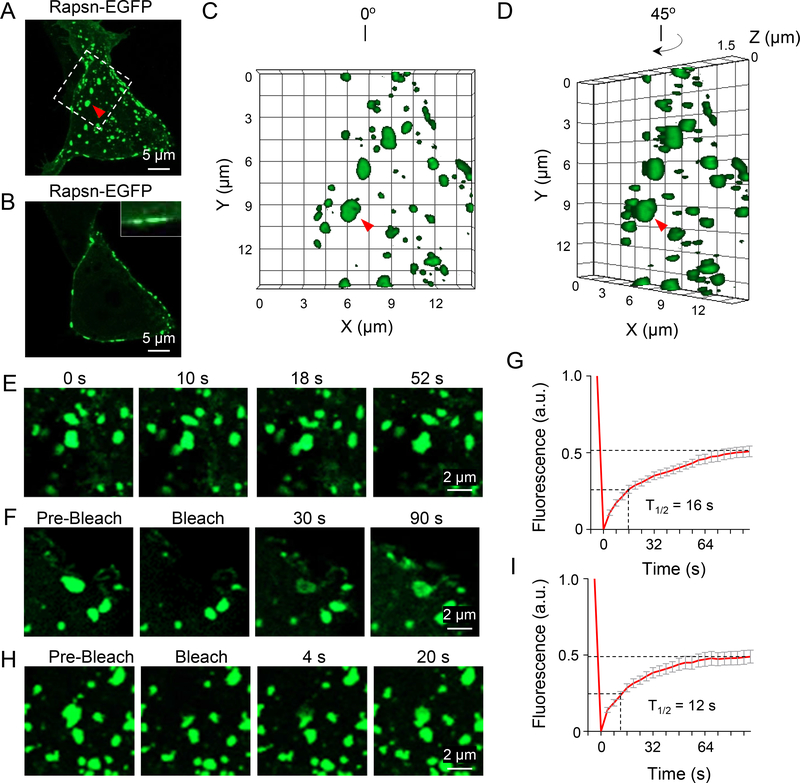
Figure 2. Rapsn LLPS into liquid-like compartments in HEK293T cells.
(A-D) Formation of membrane-attached Rapsn-EGFP puncta in transfected HEK293T cells. (A) Representative 3D projection image showing circular or oval Rapsn-EGFP puncta; (B) Single panel image showing membrane-attached Rapsn-EGFP puncta; (C) High-magnification image showing highlighted region in (A); (D) View of the same image of (C) at different angle. White arrow, membrane-attached puncta. Red triangle, same puncta in (A), (C) and (D).
(E) Fusion of two Rapsn-EGFP puncta in HEK293T cells.
(F-I) Dynamic exchange of Rapsn-EGFP between puncta and surrounding milieu, and within puncta in HEK293T cells. (F) FRAP analysis of a Rapsn-EGFP puncta, and (H) quantification of fluorescence recovery; (G) FRAP analysis of a part of puncta and (I) quantification of fluorescence recovery.
Data was shown as mean ± SEM; n = or > 3.
See also Figure S2.

