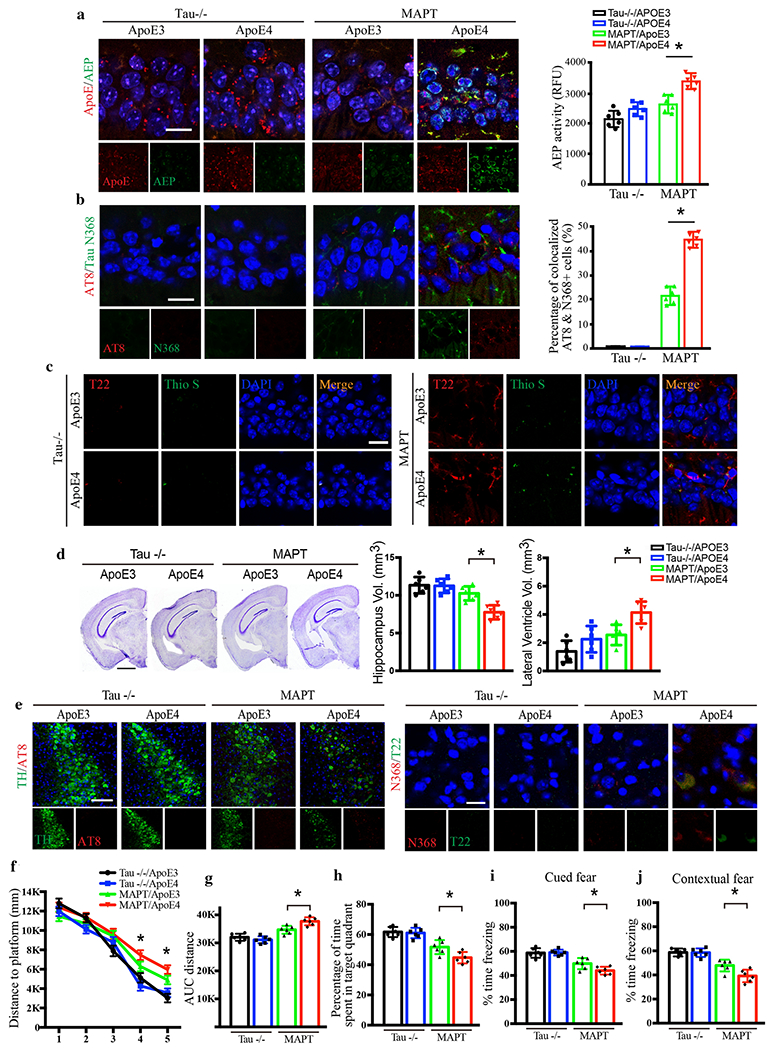
Fig. 5. Tau is necessary for ApoE4-mediated AD pathology and cognitive deficits.

AAV-ApoE3 or AAV-ApoE4 was injected into the hippocampus of MAPT or Tau −/− mice, and then mice were assessed for Tau pathology and memory dysfunctions 3 months later, a. Representative images of ApoE and AEP immunofluorescence co-staining verifying viral infection of AAV-ApoE3 or AAV-ApoE4, and AEP enzymatic assay for MAPT and Tau−/− mice. Scale bar is 20 μm. Data are shown as mean ± SEM. N=6 per group. * p<0.05. b. Representative images of immunofluorescence staining of AT8 (red), Tau N368 (green), and DAPI (blue) and quantification of co-localized cells to show Tau phosphorylation and cleavage in the hippocampus. Scale bar is 20 μm. Data are shown as mean ± SEM. N=6 per group. * p<0.05. c. Representative images of immunofluorescence staining of Thioflavin S (green), T22 (red), and DAPI (blue) to show Tau aggregation and fibrillization. Scale bar is 20 μm. d. Cresyl violet staining and quantitative analysis of hippocampus and lateral ventricle volumes indicate that ApoE4 mediated the hippocampal atrophy in MAPT mice but not Tau −/− mice. Scale bar is 1 mm. Data are shown as mean ± SEM. N=6 per group. * p<0.05. e. Representative images of immunofluorescence staining of TH (green), AT8 (red), and DAPI (blue) in the LC regions of ApoE-injected Tau −/− and MAPT mice (left panels). Scale bar is 100 μm. Right panels are representative images by N368 (red) and T22 (green) immunofluorescence co-staining to show Tau cleavage and aggregation in the LC. Scale bar is 20 μm. Behavioral tests for Morris water maze (f-h) and fear conditioning test (i & j) demonstrating memory dysfunctions mediated by ApoE4 in MAPT mice. Distance travelled to the platform (f), area under the curve for total distance travelled (g), and percent time spent in the quadrant (h) previously containing the platform during the probe trial in the Morris water maze. Percent time spent freezing during the cued fear (i) and contextual fear (j) tests following fear conditioning. All data were analyzed using one-way ANOVA and shown as mean ± SEM. N = 6 per group. * p < 0.05.
